Released: February 1, 2012
Next Release: February 8, 2012
The Short-Term Outlook for Non-OPEC Production Growth
Markets often focus on anticipated crude oil production from members of the Organization of the Petroleum Exporting Countries (OPEC) as a key driver of supply/demand tightness. Such attention is particularly understandable now, given the return of Libyan production, reports of record-high Saudi production, mixed news from Iraq (strong production growth recently and projections of more to come, tempered by political uncertainty), and now further sanctions against Iran by the United States and other countries. However, crude and liquid fuels production (crude oil, lease condensates, natural gas plant liquids, biofuels, other liquids, and refinery processing gains) in countries outside of the OPEC accounts for most of the world's production (59 percent in 2011), making prospects for non-OPEC production critical to the outlook for world oil markets.
The U.S. Energy Information Administration's (EIA) January Short-Term Energy Outlook (STEO) forecasts non-OPEC crude and liquid fuels production to grow by 0.9 million barrels per day (bbl/d) in 2012, followed by growth of 0.8 million bbl/d in 2013. Taking account of projected growth in the supply of crude and liquid fuels from both OPEC and non-OPEC suppliers, EIA anticipates the recent tightening of world oil markets will moderate somewhat in 2012, as the projected growth in supply outpaces the anticipated growth in demand. Total crude and liquid fuels production in 2012 is expected to grow by about 1.4 million bbl/d and projected demand will increase by about 1.3 million bbl/d. This easing is expected to be relatively short-lived, however, as projected consumption growth of about 1.5 million bbl/d in 2013 significantly outpaces non-OPEC supply growth in that year.
The significant forecast growth in non-OPEC crude and liquid fuels production over the next two years represents an uptick from the slower rate of growth projected in previous forecasts during 2011. The modest production increase of just 90,000 bbl/d estimated for 2011 now appears to have been a temporary dip in non-OPEC crude and liquid fuels production growth.
Because non-OPEC countries account for so much production, non-OPEC crude and liquid fuels production growth is a major source of uncertainty surrounding the outlook for oil prices, as discussed in the EIA STEO. In recent years, initial forecasts of non-OPEC production have often missed the mark by a considerable margin. These revisions have reflected inherently unpredictable events such as supply disruptions, shut-ins, and technical difficulties (such as those experienced in Syria, Yemen, and Azerbaijan), as well as the effects of better-than-expected recovery rates (as in the case of Kazakhstan) and higher-than-expected decline rates (such as in the North Sea).
Non-OPEC production growth for 2012 and 2013 should be very much dominated by the Western Hemisphere (see Figure 1), where production also grew in 2011. U.S., Canadian, and Brazilian supplies continue to expand, more than offsetting continued, albeit relatively modest, declines in Mexico. Each of the three former countries is expected to show growth of between close to 325,000 bbl/d and 340,000 bbl/d over the two-year forecast period. Other non-OPEC countries expected to show production growth include China and Kazakhstan, each of which EIA expects to show production growth between 220,000 bbl/d and 250,000 bbl/d over the next two years.
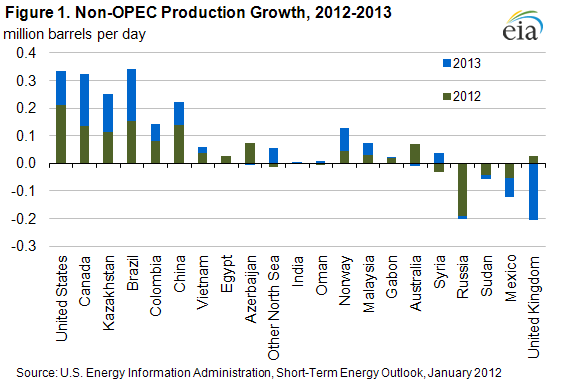
EIA estimates that U.S. crude oil and liquid fuels production averaged 9.95 million bbl/d in 2011, an increase of 260,000 bbl/d over 2010. Total crude oil and liquid fuels production in 2012 is expected to rise by an additional 210,000 bbl/d, driven by a projected 270,000 bbl/d increase in the lower-48 onshore crude oil production (which is partially offset by production declines in other areas). Expected production increases in 2012 and 2013 are supported mainly by expanding shale oil production. The STEO projects that U.S. crude oil and liquid fuels production will total 10.2 million bbl/d in 2012 and 10.3 million bbl/d in 2013.
In contrast, Russia, which had accounted for the bulk of non-OPEC growth between 2000 and 2007, looks set to contract in 2012-2013. EIA expects Russia's crude oil and liquid fuels production to fall by about 190,000 bbl/d in 2012 and an additional 12,000 bbl/d in 2013. These declines follow production of 10.3 million bbl/d in 2011, a post-Soviet record-high that positioned Russia as the world's top producer. Russia's government introduced tax decreases on some petroleum exports, which seems to have affected total exports in the last quarter of 2011. Additionally, production in the eastern part of the country offset the Western Siberia declines to some extent. EIA expects, however, that absent meaningful tax structure reform, investment will remain scarce, contributing to the projected drop in Russia's production in 2012 and 2013.
North Sea and Mexico crude oil and liquid fuels production is also expected to fall. EIA forecasts declines in the North Sea, with annual average production dropping by 80,000 bbl/d in 2013. Recent discoveries of new oil fields in the North Sea are not expected to start producing in time to significantly contribute to production prior to the second half of 2013. In Mexico, crude oil and liquid fuels production has recently stabilized, largely due to a slower rate of decline from Cantarell - once the country's largest field - and increased output from other significant offshore field complexes such as Ku-Maloob-Zaap. Nonetheless, EIA expects the slow decline in Mexican crude oil and liquid fuels production to accelerate slightly in 2012 and 2013, as the sector's growth areas fail to compensate for declines in more mature fields. The STEO projects Mexico's production will fall by about 55,000 bbl/d in 2012, and then a further 65,000 bbl/d in 2013.
Average retail gasoline price moves up a nickel
The U.S. average retail price of regular gasoline increased a nickel to $3.44 per gallon. The average price is $0.34 per gallon higher than last year at this time. Prices were up in all regions. The largest increase occurred on the East Coast where the $3.52 per gallon average was almost 7 cents above last week. The Gulf Coast had an increase of more than 6 cents to put the price at $3.29 per gallon. The Midwest price was over 4 cents higher and the West Coast average increased 3 cents to $3.65 per gallon. The Rocky Mountain region tallied the smallest increase, almost 2 cents per gallon, to the lowest regional price of $3.03 per gallon.
The national average diesel price increased less than a penny to remain at $3.85 per gallon. The diesel price is $0.41 per gallon higher than last year at this time. Prices across all major regions changed less than a penny from the previous week. The East Coast average increased almost a cent to $3.95 per gallon while the Gulf Coast price was slightly higher. The Midwest, Rocky Mountain, and West Coast regional prices decreased slightly with the West Coast averaging $4.03 per gallon.
U.S. average heating oil price increases
The U.S. residential heating oil price increased by $0.01 per gallon during the week ending January 30, 2012 to $3.95 per gallon. This price is $0.43 per gallon higher than the same time last year. The wholesale heating oil price increased by $0.08 per gallon over the same period to $3.16 per gallon, $0.36 per gallon higher than last year at this time.
The average residential propane price increased by less than $0.01 per gallon during the week ending January 30 to reach a price of almost $2.87 per gallon, which is $0.05 per gallon higher than last year. The average wholesale propane price remained flat at $1.23 per gallon over the same period. This was a decrease of about $0.19 per gallon when compared with the January 31, 2011 price of $1.42 per gallon.
Propane inventories continue to fall
U.S. inventories of propane continued to decline last week, falling 1.8 million barrels to end at 49.0 million barrels in total. Inventories are currently above the five-year average level despite starting off the heating season below average, due to unusually warm winter temperatures this year. Most of the stock draw occurred in the Midwest region, which declined by 1.1 million barrels. East Coast stocks dropped by 0.4 million barrels, while the Gulf Coast and Rocky Mountain/West Coast regional stocks each fell by 0.1 million barrels. Propylene non-fuel use inventories represented 10.2 percent of total propane inventories.
Text from the previous editions of This Week In Petroleum is accessible through a link at the top right-hand corner of this page.
 |
 |
||||||
 |
 |
||||||
| Retail Data | Changes From | Retail Data | Changes From | ||||
| 01/30/12 | Week | Year | 01/30/12 | Week | Year | ||
| Gasoline | 3.439 | Heating Oil | 3.951 | ||||
| Diesel Fuel | 3.850 | Propane | 2.865 | ||||
 |
 |
||||||||||||||||||||||||||
|
 |
||||||||||||||||||||||||||
| *Note: Crude Oil Price in Dollars per Barrel. | |||||||||||||||||||||||||||
 |
 |
||||||
 |
 |
||||||
| Stocks Data | Changes From | Stocks Data | Changes From | ||||
| 01/27/12 | Week | Year | 01/27/12 | Week | Year | ||
| Crude Oil | 338.9 | Distillate | 145.4 | ||||
| Gasoline | 230.1 | Propane | 48.989 | ||||