In the News:
The Henry Hub natural gas spot price declined 41% in January
The natural gas price at the U.S. benchmark Henry Hub declined by 41%, or $2.26 per million British thermal units (MMBtu), in January 2023 compared with December 2022. The price decline was driven by warmer-than-average temperatures across the United States in January that reduced consumption of natural gas for space heating and by increased natural gas production. In our February Short-Term Energy Outlook (STEO), we forecast the natural gas price at the Henry Hub will average $3.40/MMBtu in 2023.
Typically, U.S. natural gas prices increase in the winter as temperatures decrease and demand for space heating increases. This past January was the warmest since 2006 and had 16% fewer heating degree days (HDDs, a measure of how cold it is) than the 10-year (2013–2022) average. As a result, we estimate that in January, consumption of natural gas in the residential and commercial sectors, combined, averaged 40.1 billion cubic feet per day (Bcf/d), which is 15% lower than the five-year (2018–2022) average for January. The relatively low demand for natural gas contributed to a lower January price. In addition, an outage at the Freeport LNG liquefied natural gas export facility has resulted in approximately 2.0 Bcf/d less feedgas demand since mid-June 2022.
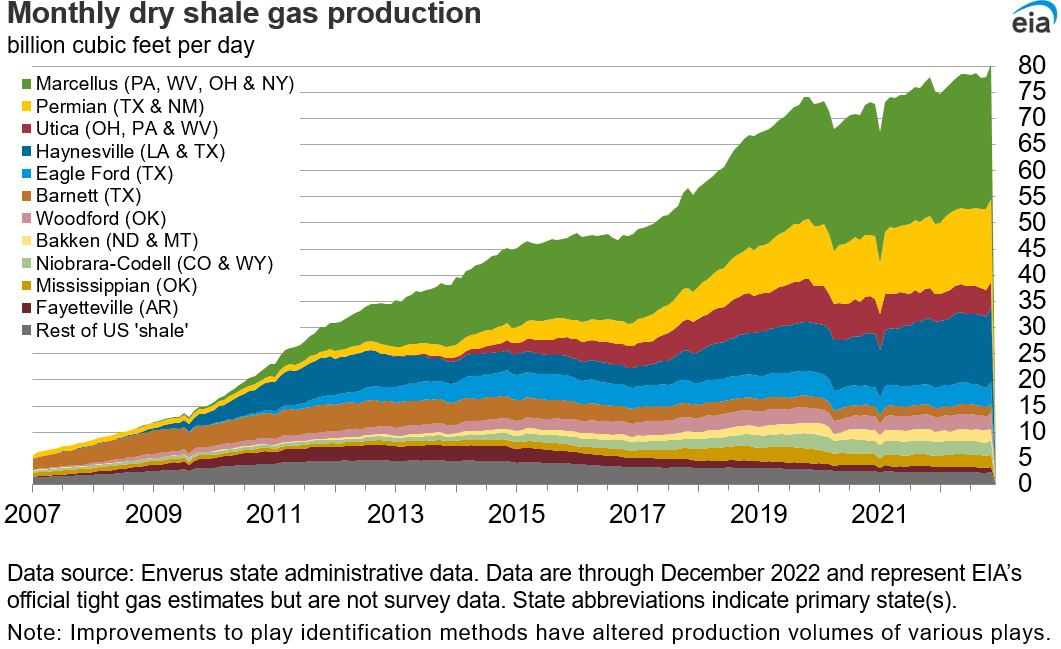
We estimate that dry natural gas production in January averaged 11% more than the five-year average (at 100.2 Bcf/d) and 5% more than last January. Relatively high production combined with less consumption in January resulted in withdrawals of natural gas from storage that were 55%, or 371 Bcf, lower than the five-year average. Natural gas in underground storage in the Lower 48 states as of February 3, 2023, totaled 2,366 Bcf, or 5% more than the five-year average. By comparison, for the week ending December 30, 2022, natural gas in underground storage in the Lower 48 states was 7% below the five-year (2017–2021) average.
We discuss supply and demand dynamics like these and their effects on natural gas prices in the recently released STEO supplement titled Market Drivers and Other Factors Affecting Natural Gas Prices.
Market Highlights:
(For the week ending Wednesday, February 15, 2023)Prices
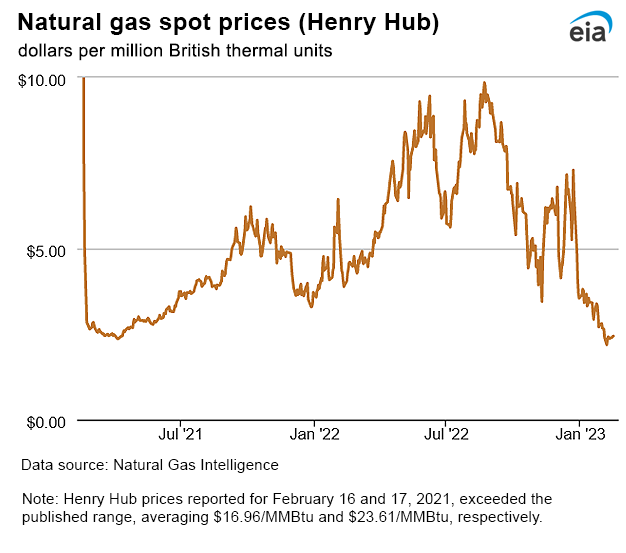
- Henry Hub spot price: The Henry Hub spot price rose 2 cents from $2.42 per million British thermal units (MMBtu) last Wednesday to $2.44/MMBtu yesterday.
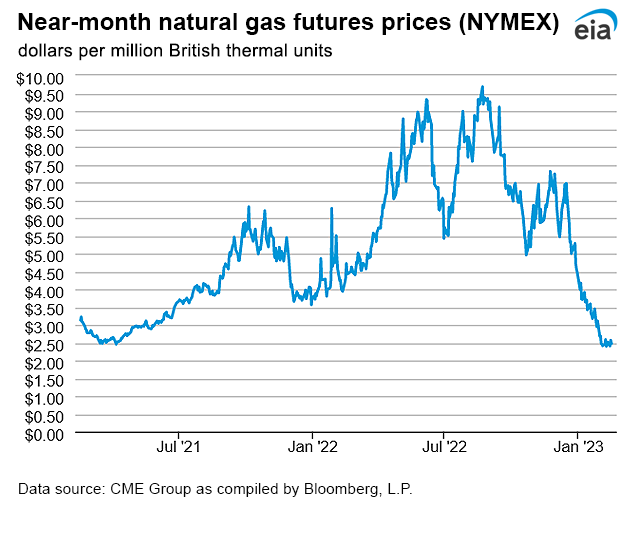
- Henry Hub futures prices: The price of the March 2023 NYMEX contract increased 7.5 cents, from $2.396/MMBtu last Wednesday to $2.471/MMBtu yesterday. The price of the 12-month strip averaging March 2023 through February 2024 futures contracts climbed 3.3 cents to $3.228/MMBtu.
- Select regional spot prices: Natural gas spot price changes were mixed this report week (Wednesday, February 8, to Wednesday, February 15), rising in the West and falling in the Midwest and East. Week-over-week price changes ranged from an increase of $2.44/MMBtu at SoCal Citygate to a decrease of $0.39/MMBtu at Algonquin Citygate.
- The price at PG&E Citygate in Northern California rose $2.41, up from $5.03/MMBtu last Wednesday to $7.44/MMBtu yesterday. The price at SoCal Citygate in Southern California increased $2.43 from $5.25/MMBtu last Wednesday to $7.68/MMBtu yesterday. The price at Malin, Oregon, the northern delivery point into the PG&E service territory, rose $1.85 from $4.79/MMBtu last Wednesday to $6.64/MMBtu yesterday. The price at Sumas on the Canada-Washington border rose $1.78 from $4.58/MMBtu last Wednesday to $6.36/MMBtu yesterday. According to data from S&P Global Commodity Insights, natural gas consumption in the West increased 4%, or 0.5 billion cubic feet per day (Bcf/d), to an average of 12.2 Bcf/d this week. Consumption in the electric power sector rose 5% (0.2 Bcf/d), while consumption in the industrial, residential, and commercial sectors combined rose 3% (0.3 Bcf/d). Temperatures in the Riverside Area, east of Los Angeles, averaged 53°F this week, resulting in 16 more heating degree days (HDD) than normal. Total supply in the West increased 1% (0.2 Bcf/d). Although prices in the West rose week over week, they were well below the January average prices of $16.80/MMBtu at PG&E Citygate, $18.04/MMBtu at SoCal Citygate, $15.74/MMBtu at Malin, and $13.47/MMBtu at Sumas.
- At the Chicago Citygate, the price decreased 5 cents from $2.44/MMBtu last Wednesday to $2.39/MMBtu yesterday. Yesterday’s price is 40% lower than the price on February 15, 2022. Total natural gas consumption in the Midwest declined 20% (3.8 Bcf/d) week over week, according to data from S&P Global Commodity Insights, due mostly to a 26% (3.0 Bcf/d) decrease in residential and commercial sector consumption. The decline in natural gas consumption in the Midwest was driven by higher-than-average temperatures. In the Chicago Area, temperatures averaged 12°F above normal this week, resulting in 84 fewer HDDs than normal.
- In the Northeast, spot natural gas prices in key downstream hubs, normally influenced by constrained natural gas pipelines, decreased week over week due to a 25% (7.2 Bcf/d) decrease in regional natural gas consumption and a 3% (1.0 Bcf/d) increase in regional natural gas supply, according to data from S&P Global Commodity Insights. At the Algonquin Citygate, which serves Boston-area consumers, the price went down 39 cents from $2.52/MMBtu last Wednesday to $2.13/MMBtu yesterday. At the Transcontinental Pipeline Zone 6 trading point for New York City, the price decreased 7 cents from $2.12/MMBtu last Wednesday to $2.05/MMBtu yesterday. Temperatures in the Boston Area averaged 42°F this report week, 11°F above normal, which resulted in 79 fewer HDDs than normal. A daily high of 60°F was recorded last Friday in Boston, and the area is on track to have one of its warmest winters on record. In the New York-Central Park Area, temperatures averaged 48°F, 13°F above normal, resulting in 92 fewer HDDs than normal.
- The price at the Waha Hub in West Texas, which is located near Permian Basin production activities, rose 21 cents this report week, from $1.90/MMBtu last Wednesday to $2.11/MMBtu yesterday. The Waha Hub traded 33 cents below the Henry Hub price yesterday, compared with last Wednesday when it traded 52 cents below the Henry Hub price. On Tuesday, El Paso Natural Gas Company, L.L.C. (EPNG) lifted its force majeure on Line 2000, which delivers natural gas west out of the Permian Basin. An updated February maintenance schedule indicates restrictions on Line 2000 have been lifted effective yesterday, February 15. The return of Line 2000 to full service will increase natural gas takeaway capacity from New Mexico and West Texas by close to 0.5 Bcf/d, increasing supplies into the Desert Southwest and the California border.
- International futures prices: International natural gas futures prices decreased this report week. According to Bloomberg Finance, L.P., weekly average front-month futures prices for liquefied natural gas (LNG) cargoes in East Asia decreased 39 cents to a weekly average of $17.91/MMBtu. Natural gas futures for delivery at the Title Transfer Facility (TTF) in the Netherlands, the most liquid natural gas market in Europe, decreased $1.15 to a weekly average of $16.68/MMBtu. In the same week last year (week ending February 16, 2022), the prices in East Asia and at TTF were $24.43/MMBtu and $24.87/MMBtu, respectively.
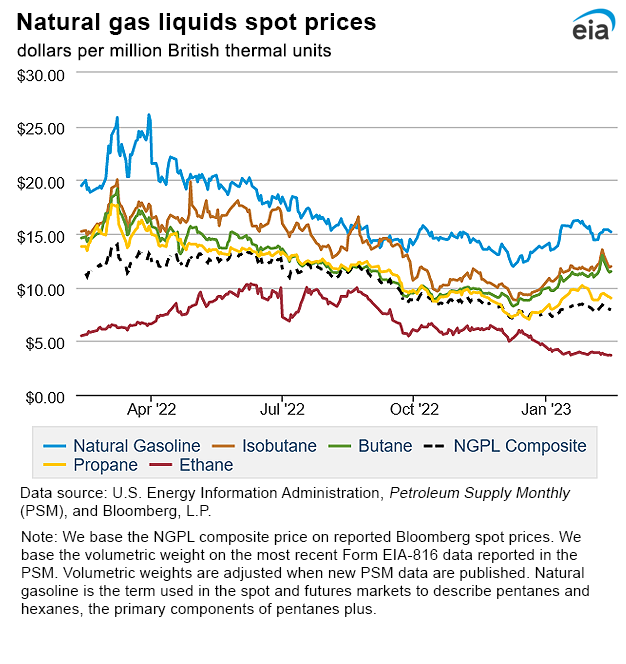
- Natural gas plant liquids (NGPL) prices: The natural gas plant liquids composite price at Mont Belvieu, Texas, rose by 13 cents/MMBtu, averaging $8.11/MMBtu for the week ending February 15. Ethane prices fell 4%, while average weekly natural gas prices at the Houston Ship Channel rose 4% week over week, narrowing the ethane premium to natural gas by 13%. Ethylene spot prices rose 2%, widening the ethylene to ethane premium by 7%. The Brent crude oil price rose 3%, and the propane price followed, also rising 3%, resulting in a 5% increase in the propane discount relative to crude oil. Prices for heavier NGPLs also increased with the crude oil price. Normal butane prices rose 4%, while isobutane and natural gasoline prices each rose 3%.
Daily spot prices by region are available on the EIA website.
Supply and Demand
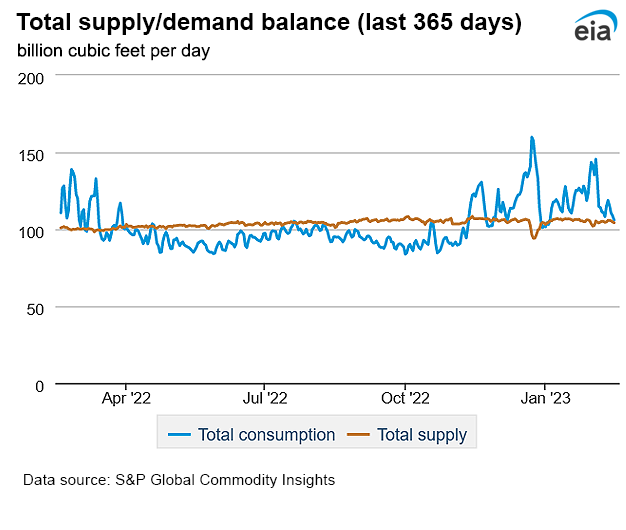
- Supply: According to data from S&P Global Commodity Insights, the average total supply of natural gas rose by 0.5% (0.6 Bcf/d) compared with the previous report week. An increase in dry natural gas production of 1.9% (1.9 Bcf/d) was partially offset by a decrease in average net imports from Canada, which fell 22.6% (1.2 Bcf/d) from last week.
- Demand: Total U.S. consumption of natural gas fell by 12.2% (12.0 Bcf/d) compared with the previous report week, according to data from S&P Global Commodity Insights. Natural gas consumption in the residential and commercial sectors declined by 22.4% (9.5 Bcf/d) driven by warmer weather across the eastern part of the country. Consumption in the electric power sector declined by 5.2% (1.6 Bcf/d) and industrial sector consumption fell by 3.6% (0.9 Bcf/d). Natural gas exports to Mexico increased 2.6% (0.1 Bcf/d). Natural gas deliveries to U.S. LNG export facilities (LNG pipeline receipts) averaged 12.9 Bcf/d, or 0.5 Bcf/d higher than last week.
Liquefied Natural Gas (LNG)
- Pipeline receipts: Overall natural gas deliveries to U.S. LNG export terminals increased by 3.9% (0.5 Bcf/d) week over week to 12.9 Bcf/d, according to data from S&P Global Commodity Insights. Natural gas deliveries to terminals in South Louisiana increased by 2.2% (0.2 Bcf/d) to 9.0 Bcf/d, while deliveries to Texas terminals increased by 6.6% (0.2 Bcf/d) to 2.7 Bcf/d. Natural gas deliveries to terminals along the East Coast increased by 10.8% (0.1 Bcf/d) to 1.2 Bcf/d over the same period. On several days at the end of the report week, overall natural gas deliveries reached 13 Bcf/d for the first time since May 2022.
- Vessels departing U.S. ports: Twenty-six LNG vessels (nine from Sabine Pass; four each from Calcasieu Pass, Cameron, and Corpus Christi; three from Freeport; and one each from Cove Point and Elba Island) with a combined LNG-carrying capacity of 98 Bcf departed the United States between February 9 and February 15, according to shipping data provided by Bloomberg Finance, L.P.
- LNG Terminals: On February 9, Freeport LNG received approval from the Federal Energy Regulatory Commission (FERC) to resume ship loading activities from LNG Dock 1 facilities. Three vessels departed Freeport LNG this week, after loading LNG out of storage tanks. They were the first cargoes to load and depart from the terminal since June 2022. Additional authorizations are needed for a full restart of operations.
- Vessels arriving at U.S. ports: One LNG vessel with a carrying capacity of 3 Bcf docked for off-loading at the Everett LNG terminal in Boston Harbor in Massachusetts between February 9 and February 15, according to shipping data provided by Bloomberg Finance, L.P. This delivery is the fifth to the terminal since November 2022.
Rig Count
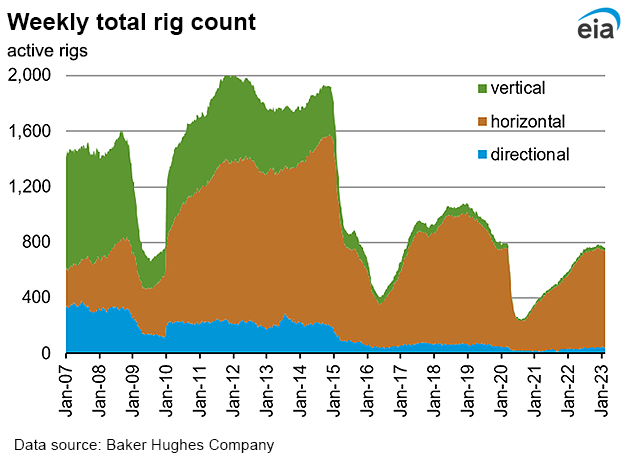
- Rig activity for natural gas and oil-directed rigs last week was mixed. According to Baker Hughes, for the week ending Tuesday, February 7, the natural gas rig count decreased by 8 rigs from a week ago to 150 rigs. The Haynesville added one rig, the Eagle Ford and Marcellus each dropped one rig, and the Permian dropped seven rigs. The number of oil-directed rigs increased by 10 rigs from a week ago to 609 rigs. The Permian added five rigs, the Cana Woodford added two rigs, and eight rigs were added in unidentified producing regions. The Ardmore Woodford dropped four rigs, and the Barnett dropped one rig. The total rig count, which includes 2 miscellaneous rigs, stands at 761 rigs, compared with 635 rigs in the same report week a year ago.
Storage
- The net withdrawals from storage totaled 100 Bcf for the week ending February 10, compared with the five-year (2018–2022) average net withdrawals of 166 Bcf and last year's net withdrawals of 195 Bcf during the same week. Working natural gas stocks totaled 2,266 Bcf, which is 183 Bcf (9%) more than the five-year average and 328 Bcf (17%) more than last year at this time. South Central region stocks exceed the five-year average by 178 Bcf (24%).
- According to The Desk survey of natural gas analysts, estimates of the weekly net change to working natural gas stocks ranged from net withdrawals of 82 Bcf to 125 Bcf, with a median estimate of 110 Bcf.
- The average rate of withdrawals from storage is 19% lower than the five-year average so far in the withdrawal season (November through March). If the rate of withdrawals from storage matched the five-year average of 11.2 Bcf/d for the remainder of the withdrawal season, the total inventory would be 1,715 Bcf on March 31, which is 183 Bcf higher than the five-year average of 1,532 Bcf for that time of year.
See also:
Top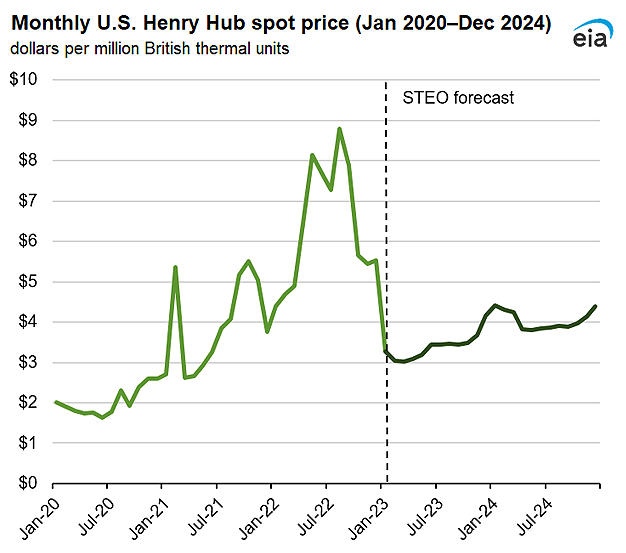
Data source: U.S. Energy Information Administration, Short-Term Energy Outlook (STEO)
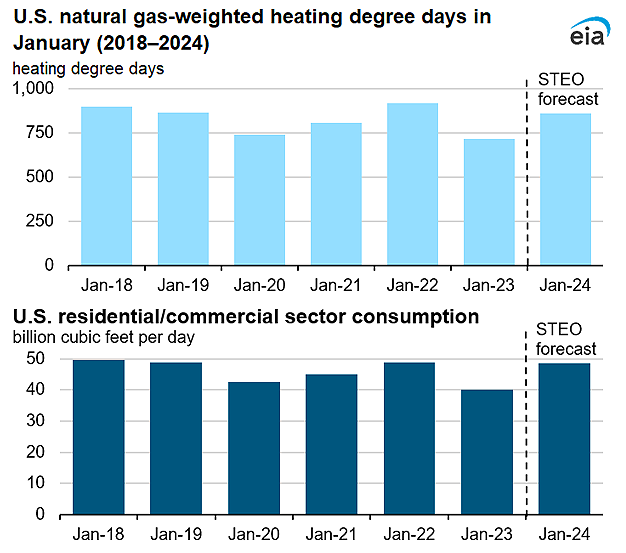
Data source: U.S. Energy Information Administration, Short-Term Energy Outlook (STEO)
Note: Residential/commercial sector consumption of natural gas for January 2023 is a STEO estimate.
| Spot Prices ($/MMBtu) | Thu, 09-Feb |
Fri, 10-Feb |
Mon, 13-Feb |
Tue, 14-Feb |
Wed, 15-Feb |
|---|---|---|---|---|---|
| Henry Hub |
2.40 |
2.37 |
2.40 |
2.43 |
2.44 |
| New York |
2.05 |
2.06 |
2.06 |
1.93 |
2.05 |
| Chicago |
2.35 |
2.29 |
2.27 |
2.34 |
2.39 |
| Cal. Comp. Avg.* |
5.28 |
5.44 |
5.91 |
5.02 |
7.16 |
| Futures ($/MMBtu) | |||||
| March contract | 2.430 |
2.514 |
2.405 |
2.567 |
2.471 |
| April contract |
2.492 |
2.607 |
2.499 |
2.652 |
2.555 |
| *Avg. of NGI's reported prices for: Malin, PG&E Citygate, and Southern California Border Avg. | |||||
| Source: NGI's Daily Gas Price Index | |||||
| U.S. natural gas supply - Gas Week: (2/9/23 - 2/15/23) | |||
|---|---|---|---|
Average daily values (billion cubic feet) |
|||
this week |
last week |
last year |
|
| Marketed production | 113.0 |
110.9 |
107.5 |
| Dry production | 100.6 |
98.8 |
95.1 |
| Net Canada imports | 4.2 |
5.5 |
5.9 |
| LNG pipeline deliveries | 0.1 |
0.2 |
0.3 |
| Total supply | 105.0 |
104.4 |
101.3 |
|
Data source: S&P Global Commodity Insights | |||
| U.S. natural gas consumption - Gas Week: (2/9/23 - 2/15/23) | |||
|---|---|---|---|
Average daily values (billion cubic feet) |
|||
this week |
last week |
last year |
|
| U.S. consumption | 86.3 |
98.3 |
96.1 |
| Power | 29.4 |
31.0 |
27.7 |
| Industrial | 24.0 |
24.9 |
25.5 |
| Residential/commercial | 32.9 |
42.4 |
42.8 |
| Mexico exports | 5.2 |
5.1 |
5.4 |
| Pipeline fuel use/losses | 7.3 |
7.5 |
7.3 |
| LNG pipeline receipts | 12.9 |
12.5 |
12.6 |
| Total demand | 111.8 |
123.4 |
121.3 |
|
Data source: S&P Global Commodity Insights | |||
| Rigs | |||
|---|---|---|---|
Tue, February 07, 2023 |
Change from |
||
last week |
last year |
||
| Oil rigs | 609 |
1.7% |
18.0% |
| Natural gas rigs | 150 |
-5.1% |
27.1% |
| Note: Excludes any miscellaneous rigs | |||
| Rig numbers by type | |||
|---|---|---|---|
Tue, February 07, 2023 |
Change from |
||
last week |
last year |
||
| Vertical | 18 |
-14.3% |
-35.7% |
| Horizontal | 700 |
0.0% |
22.0% |
| Directional | 43 |
13.2% |
30.3% |
| Data source: Baker Hughes Company | |||
| Working gas in underground storage | ||||
|---|---|---|---|---|
Stocks billion cubic feet (Bcf) |
||||
| Region | 2023-02-10 |
2023-02-03 |
change |
|
| East | 498 |
529 |
-31 |
|
| Midwest | 601 |
641 |
-40 |
|
| Mountain | 114 |
120 |
-6 |
|
| Pacific | 122 |
124 |
-2 |
|
| South Central | 931 |
951 |
-20 |
|
| Total | 2,266 |
2,366 |
-100 |
|
| Data source: U.S. Energy Information Administration Form EIA-912, Weekly Underground Natural Gas Storage Report | ||||
| Working gas in underground storage | |||||
|---|---|---|---|---|---|
Historical comparisons |
|||||
Year ago (2/10/22) |
5-year average (2018-2022) |
||||
| Region | Stocks (Bcf) |
% change |
Stocks (Bcf) |
% change |
|
| East | 442 |
12.7 |
470 |
6.0 |
|
| Midwest | 504 |
19.2 |
545 |
10.3 |
|
| Mountain | 115 |
-0.9 |
118 |
-3.4 |
|
| Pacific | 178 |
-31.5 |
197 |
-38.1 |
|
| South Central | 700 |
33.0 |
753 |
23.6 |
|
| Total | 1,938 |
16.9 |
2,083 |
8.8 |
|
| Data source: U.S. Energy Information Administration Form EIA-912, Weekly Underground Natural Gas Storage Report | |||||
| Temperature – heating & cooling degree days (week ending Feb 09) | ||||||||
|---|---|---|---|---|---|---|---|---|
HDDs |
CDDs |
|||||||
| Region | Current total |
Deviation from normal |
Deviation from last year |
Current total |
Deviation from normal |
Deviation from last year |
||
| New England | 271 |
2 |
23 |
0 |
0 |
0 |
||
| Middle Atlantic | 243 |
-15 |
-5 |
0 |
0 |
0 |
||
| E N Central | 245 |
-38 |
-59 |
0 |
0 |
0 |
||
| W N Central | 257 |
-35 |
-49 |
0 |
0 |
0 |
||
| South Atlantic | 141 |
-31 |
-17 |
8 |
1 |
2 |
||
| E S Central | 129 |
-43 |
-61 |
0 |
0 |
0 |
||
| W S Central | 97 |
-25 |
-76 |
1 |
-3 |
1 |
||
| Mountain | 216 |
2 |
-22 |
0 |
-1 |
0 |
||
| Pacific | 110 |
2 |
20 |
0 |
0 |
0 |
||
| United States | 190 |
-21 |
-28 |
2 |
1 |
1 |
||
|
Data source: National Oceanic and Atmospheric Administration Note: HDDs=heating degree days; CDDs=cooling degree days | ||||||||
Average temperature (°F)
7-day mean ending Feb 09, 2023
Data source: National Oceanic and Atmospheric Administration
Deviation between average and normal temperature (°F)
7-day mean ending Feb 09, 2023
Data source: National Oceanic and Atmospheric Administration