In the News:
Asia Pacific imports of LNG down in 2015 on mild weather, lower demand for power generation
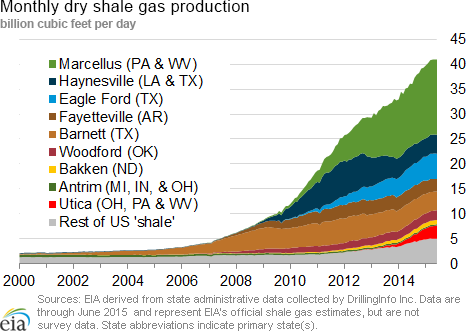
Imports of liquefied natural gas (LNG) in Japan, South Korea, and China, the three largest global importers, all located in the Asia Pacific region, have declined by an average 1.4 billion cubic feet per day (Bcf/d) (6.7%) in the first five months of 2015 compared to the same period in 2014. These three countries accounted for 61% of global LNG imports in 2014 according to data from the International Group of Liquefied Natural Gas Importers. Reduced consumption of LNG was largely driven by higher use of coal-fired and nuclear power plants in South Korea, lower consumption of natural gas in power generation (gas burn) in Japan, and increased imports of lower-priced pipeline gas in China. South Korea accounted for the largest decrease in LNG imports, an average 0.9 Bcf/d (15.1%) in January-May 2015 as compared to the same period in 2014, primarily because of a decline in gas use in power generation.
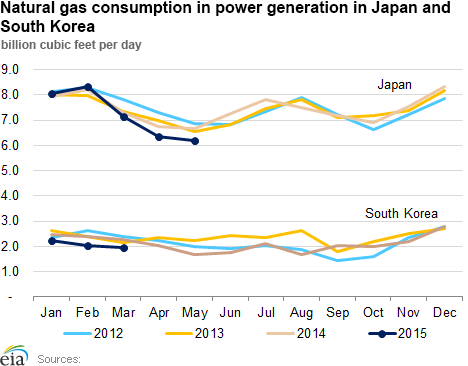
In South Korea, mild winter and government policies, which favor the use of coal and nuclear over natural gas in the power generation mix, led to declines in natural gas consumption in the power sector for the past two years. Nuclear generation has been increasing since the end of a nuclear safety scandal in early 2014 involving irregularities uncovered during safety inspections of nuclear facilities. Generation by coal and nuclear power plants increased by 8% and 3%, respectively, in the first quarter of 2015, as compared to the same period last year, while gas burn declined by 20%, according to data by the Korea Energy Economics Institute (KEEI). Additional nuclear capacity, including commissioning of Shin-Wolsong unit 2 this month and the restart of Shin-Wolsong unit 1 combined with relatively flat demand, is likely to further reduce the call on gas-fired generation in South Korea's power mix, and lead to lower LNG imports.
In Japan, lower LNG imports in the first five months of 2015 were largely driven by lower demand for gas-fired generation in the power sector. Consumption of all fossil fuels (coal, crude oil, heavy fuel oil, and LNG) in power generation has declined year-on-year over this period, accounting for a 7% decrease in thermal generation, while hydro generation increased by 16%, according to data from the Federation of Electric Power Companies of Japan (FEPC). Fossil fuels generation has decreased despite the sharp decline in crude oil prices since the second half of 2014 and a decrease in LNG import prices, which are linked to crude oil prices with a lag of several months. The planned restarts of nuclear power plants in the coming months (Kyushu Electric's Sendai power plant Unit 1 in August and Unit 2 in October 2015, totaling 1.78 GW of capacity) and several other plants in 2016, totaling 9.4 GW, will further reduce the demand for fossil fuels generation in the coming years.
In China, LNG imports fell by 0.24 Bcf/d (8.7%) in the first five months of 2015 compared with the same period in 2014, while lower-priced pipeline imports increased by 0.6 Bcf/d (22%), according to data by the Chinese Customs Agency.
Overview:
(For the Week Ending Wednesday, July 30, 2015)
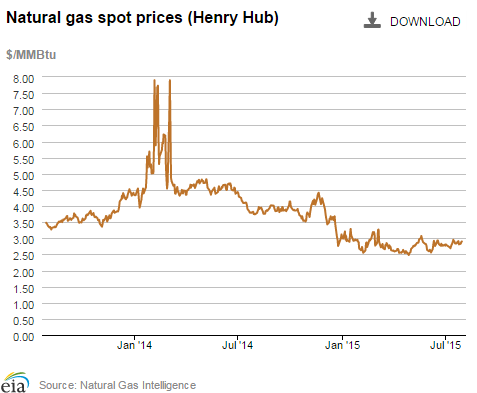
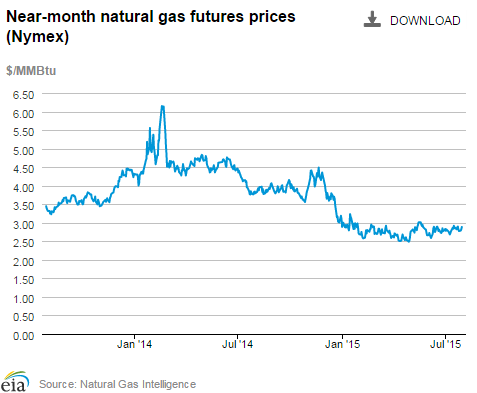
- Natural gas prices showed a slight decline at the beginning of the report week (Wednesday, July 22, through Wednesday, July 29), then moved back toward their starting point at most market locations by yesterday. The Henry Hub spot price began the week at $2.89 per million British thermal unit (MMBtu) last Wednesday, experienced minor volatility, and ended the report week up 1¢, closing at $2.90 yesterday.
- At the New York Mercantile Exchange (Nymex), the August contract began the week at $2.897/MMBtu last Wednesday and settled its position as the near-month contract on Wednesday, July 29, at $2.886/MMBtu, when it expired. On July 29 the September futures contract became the new prompt month contract, and it settled yesterday at $2.864/MMBtu.
- Working natural gas in storage increased to 2,880 Bcf as of Friday, July 24. A net injection into storage of 52 Bcf for the week resulted in storage levels 26% above a year ago and 3% above the five-year average for this week.
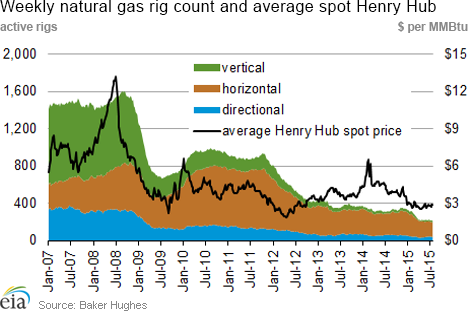
- The total U.S. oil and natural gas rig count rose this week by 19 units to 876 for the week ending Friday, July 24, according to data from Baker Hughes Incorporated. The oil rig count increased by 21 units, totaling 659, while the natural gas rig count decreased by 2 to 216. Additionally, 1 miscellaneous rig remained in operation.
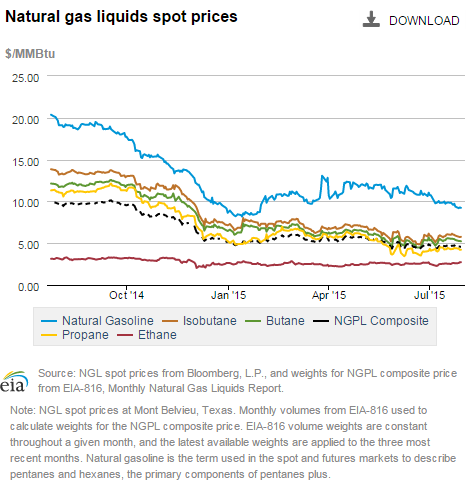
- The natural gas plant liquids composite price at Mont Belvieu, Texas, increased by 1¢ to $4.69/MMBtu for the week ending July 24. The price for natural gasoline fell 2% for the week, but prices for ethane, propane, butane, and isobutane increased modestly between 0.1% and 2% for the week ending July 24.
Prices/Demand/Supply:
Natural gas prices flat, or down slightly, at most locations. The weather generally remained warmer than average through the report week, as much as 4° Fahrenheit above normal. The warmest temperatures were felt from Texas up through the Midwest, with heat and humidity moving east through the report week. Outside of the Northeast, trading locations generally stayed within 5% of their starting point (Wednesday to Wednesday), with most dipping slightly for the weekend. The Henry Hub spot price started the report period at $2.89/MMBtu, fell to $2.81/MMBtu on Friday, and then returned to $2.90/MMBtu to end the week up 1¢ yesterday. Prices at most locations followed this pattern. In California PG&E Citygate, serving Northern California, started off at $3.27/MMBtu on Wednesday, July 22, fell 10¢ to $2.17/MMBtu on Friday, then rose back to $3.27 to close the week. Chicago Citygate, opened on July 22 at $2.93/MMBtu, dipped by 7¢ on Friday, then regained its position to close up slightly at $2.94/MMBtu yesterday.
Northeast prices down to start, but rise through the week with increasing temperatures. Northeast temperatures started the week below average by 4°, but rose through the report week to peak above average by 6°, or more, on Wednesday. While Northeast prices started lower than most, they began to rise on Monday, more than doubling from their starting prices in response to 90° temperatures at several trading locations. At Algonquin Citygate, serving Boston, prices started last Wednesday at $1.74/MMBtu, fell 20% to $1.39 on Friday while moderate temperatures held, but more than doubled on Monday to $4.12/MMBtu, as northeastern temperatures rose. As temperatures returned to normal, Algonquin Citygate fell to settle at $3.34/MMBtu yesterday.
Tennessee Zone 6 200L, supplying lower New England, followed Algonquin's rise with a similar price pattern, though not as high. It began the week at $1.73/MMBtu, peaking at $3.69 on Tuesday, to close at $3.19/MMBtu yesterday. New York City, supplied by Transcontinental Gas Pipeline Zone 6, followed Algonquin as well, nearly doubling; it opened at $1.58/MMBtu and ended the week at $3.01 yesterday.
Marcellus-area prices remain low. Marcellus-area prices increased again this week, following the heat, but still remain low. Prices at Tennessee Zone 4 Marcellus started at $1.15/MMBtu last Wednesday, rose to peak on Monday at $1.32, then fell to close yesterday at $1.24. On the Transcontinental Leidy Line, prices began last Wednesday at $1.18/MMBtu, peaked at $1.50 on Monday, and finished the report week at $1.34/MMBtu yesterday. Dominion South was nearly a carbon copy of the Leidy Line, opening at $1.19/MMBtu, bumping up to $1.52, and settling on Wednesday at $1.37/MMBtu.
Nymex prices increase. At the New York Mercantile Exchange (Nymex), the August near-month contract began the week at $2.897/MMBtu last Wednesday and settled at $2.886/MMBtu on July 29, when it expired. The September contract started the report week at $2.908/MMBtu last Wednesday, falling 4¢ to end the report week at $2.864/MMBtu yesterday; it became the prompt month contract today. The 12-month strip (the average of the September 2015 through August 2016 futures contracts) decreased from $3.130/MMBtu last Wednesday to $3.092/MMBtu yesterday.
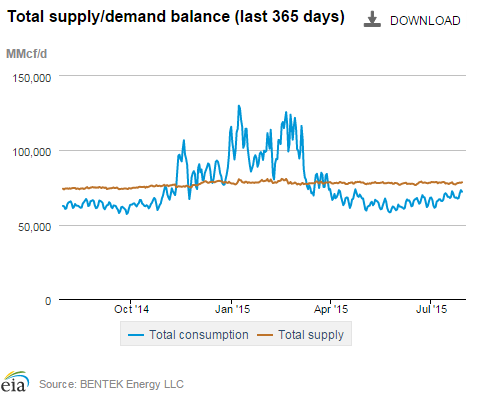
Supply increases slightly. Dry natural gas production averaged 72.1 Bcf/d for the report period, a week-over-week increase of 0.3%, according to data from Bentek Energy, and a 4.8% increase over the same period last year. Imports from Canada were generally flat this week, only 0.1% above last week, but were 15.6% above U.S. imports from Canada for the same period last year. LNG sendout, a minor contributor to supply, was down by 3.3% for the week.
Demand continues to increase, driven by the power sector. U.S. natural gas consumption was up by 0.5% this week. Though temperatures starting the week were slightly below average, the summer heat returned midweek moving average temperatures up by as much as 4°, resulting in increased consumption for power generation by 1.4% for the week. Nationally, July's power burn averaged 32.5 Bcf/d, 20% higher than in July 2014. The high temperatures seen from coast-to-coast on Tuesday, July 28, and Wednesday, July 29, set power burn records of 37.9 Bcf/d and 38.4 Bcf/d, respectively, as noted by Bentek Energy. These power burn records exceeded previous highs set in July 2012. The increased power burn levels for the report week were driven largely by consumption in the Midwest, Texas, and the Midcontinent with 21.4%, 6.1%, and 4.1% increases, respectively, with the Northeast and Southeast increasing power burn during the second half of the week. Only the Pacific Northwest and Southwest saw decreasing power burn for the week. Industrial and residential/commercial sectors saw decreased consumption, with both down 0.4% for the week. Exports to Mexico decreased 1.8% week over week, but were 27.3% above 2014 levels.
Storage
Net storage injection is higher than five-year average, but lower than last year's build. The net injection reported for the week ending July 24 was 52 Bcf, down from 61 Bcf the previous week. This compares with the five-year average increase of 48 Bcf for the week and last year's increase of 88 Bcf. Working gas inventories for the storage week totaled 2,880 Bcf, 586 Bcf (26%) higher than last year at this time and 85 Bcf (3%) higher than the five-year (2010-14) average.
Storage injections are lower than market expectations. Market expectations, on average, called for a build of 55 Bcf. When the EIA storage report was released at 10:30 a.m. on July 30, the price for the September natural gas futures contract increased by about 2¢, then drifted back down to price levels similar to before release, at about $2.82/MMBtu in Nymex futures trading. In the next hour, the price decreased further to around $2.79/MMBtu.
From the week ending April 3 (the beginning of the injection season) through the week ending July 24, net storage injections totaled 1,419 Bcf, or 42 Bcf less than the 1,461 Bcf injected during the same 17 weeks in 2014. During these weeks for the years 2010-14, net injections into storage averaged 1,144 Bcf. The estimated average unit value of the natural gas storage holders put into storage from April 3 to July 24 this year is $2.76/MMBtu, 38% lower than the average value of $4.49/MMBtu for the same 17 weeks last year. The highest winter-month Nymex price (for the January 2016 contract) in trading for the week ending July 24 averaged $3.25/MMBtu. This price is 42¢/MMBtu more than the August Nymex contract price. A year ago, the difference was 36¢/MMBtu, suggesting there is slightly more financial incentive this year to buy and store natural gas in the summer for sale in the winter.
Temperatures during the storage report week were warmer than normal. Temperatures in the Lower 48 states averaged 77° for the storage report week, 1° warmer than the 30-year normal temperature and 3° warmer than the average temperature during the same week last year. There were 83 population-weighted cooling degree days (CDD) this report week, 5 CDD fewer than the five-year average and 20 CDD more than during this week last year.
See also:
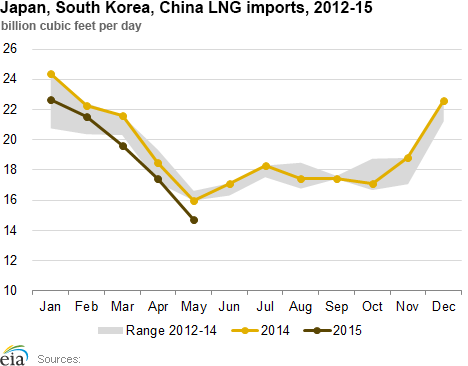 Japan Ministry of Finance, South Korea International Trade Association, China General Administration of Customs.
| Spot Prices ($/MMBtu) | Thu, 23-Jul |
Fri, 24-Jul |
Mon, 27-Jul |
Tue, 28-Jul |
Wed, 29-Jul |
|---|---|---|---|---|---|
| Henry Hub |
2.91 |
2.81 |
2.83 |
2.88 |
2.90 |
| New York |
1.50 |
1.67 |
2.96 |
2.99 |
3.01 |
| Chicago |
2.93 |
2.86 |
2.88 |
2.92 |
2.94 |
| Cal. Comp. Avg,* |
3.08 |
2.94 |
3.01 |
3.04 |
3.04 |
| Futures ($/MMBtu) | |||||
| August contract |
2.816 |
2.776 |
2.789 |
2.821 |
2.886 |
| September contract |
2.817 |
2.775 |
2.788 |
2.816 |
2.864 |
| *Avg. of NGI's reported prices for: Malin, PG&E citygate, and Southern California Border Avg. | |||||
| Source: NGI's Daily Gas Price Index | |||||
| U.S. natural gas supply - Gas Week: (7/22/15 - 7/29/15) | ||
|---|---|---|
Percent change for week compared with: |
||
last year |
last week |
|
| Gross production | 4.88%
|
0.34%
|
| Dry production | 4.84%
|
0.34%
|
| Canadian imports | 15.57%
|
0.05%
|
| West (net) | 15.30%
|
-0.65%
|
| Midwest (net) | 14.29%
|
0.61%
|
| Northeast (net) | NA |
-13.42%
|
| LNG imports | 7.70%
|
-3.27%
|
| Total supply | 5.54%
|
0.31%
|
| Source: BENTEK Energy LLC | ||
| U.S. consumption - Gas Week: (7/22/15 - 7/29/15) | ||
|---|---|---|
Percent change for week compared with: |
||
last year |
last week |
|
| U.S. consumption | 6.8%
|
0.5%
|
| Power | 18.0%
|
1.4%
|
| Industrial | -2.6%
|
-0.4%
|
| Residential/commercial | -5.1%
|
-0.4%
|
| Total demand | 7.5%
|
0.4%
|
| Source: BENTEK Energy LLC | ||
| Rigs | |||
|---|---|---|---|
Fri, July 24, 2015 |
Change from |
||
last week |
last year |
||
| Oil rigs | 659 |
3.29% |
-57.81% |
| Natural gas rigs | 216 |
-0.92% |
-32.08% |
| Miscellaneous | 1 |
0.00% |
-66.67% |
| Rig numbers by type | |||
|---|---|---|---|
Fri, July 24, 2015 |
Change from |
||
last week |
last year |
||
| Vertical | 131 |
6.50% |
-63.71% |
| Horizontal | 662 |
1.85% |
-48.80% |
| Directional | 83 |
-1.19% |
-63.76% |
| Source: Baker Hughes Inc. | |||
| Working gas in underground storage | ||||
|---|---|---|---|---|
Stocks billion cubic feet (bcf) |
||||
| Region | 2015-07-24 |
2015-07-17 |
change |
|
| East | 1,318 |
1,276 |
42 |
|
| West | 464 |
458 |
6 |
|
| Producing | 1,098 |
1,094 |
4 |
|
| Total | 2,880 |
2,828 |
52 |
|
| Source: U.S. Energy Information Administration | ||||
| Working gas in underground storage | |||||
|---|---|---|---|---|---|
Historical comparisons |
|||||
Year ago (7/24/14) |
5-year average (2010-2014) |
||||
| Region | Stocks (Bcf) |
% change |
Stocks (Bcf) |
% change |
|
| East | 1,149 |
14.7 |
1,378 |
-4.4 |
|
| West | 379 |
22.4 |
440 |
5.5 |
|
| Producing | 766 |
43.3 |
977 |
12.4 |
|
| Total | 2,294 |
25.5 |
2,795 |
3.0 |
|
| Source: U.S. Energy Information Administration | |||||
| Temperature -- heating & cooling degree days (week ending Jul 23) | ||||||||
|---|---|---|---|---|---|---|---|---|
HDD deviation from: |
CDD deviation from: |
|||||||
| Region | HDD Current |
normal |
last year |
CDD Current |
normal |
last year |
||
| New England | 1
|
-1
|
-1
|
53
|
9
|
16
|
||
| Middle Atlantic | 1
|
-1
|
-2
|
70
|
11
|
20
|
||
| E N Central | 1
|
-1
|
-7
|
58
|
0
|
21
|
||
| W N Central | 1
|
-2
|
-4
|
73
|
1
|
17
|
||
| South Atlantic | 0
|
0
|
0
|
113
|
15
|
29
|
||
| E S Central | 0
|
0
|
-2
|
114
|
19
|
48
|
||
| W S Central | 0
|
0
|
-2
|
139
|
13
|
38
|
||
| Mountain | 1
|
-3
|
0
|
67
|
-13
|
-26
|
||
| Pacific | 0
|
-3
|
-1
|
52
|
7
|
5
|
||
| United States | 1
|
-1
|
-3
|
83
|
8
|
20
|
||
|
Note: HDD = heating degree-day; CDD = cooling degree-day Source: National Oceanic and Atmospheric Administration | ||||||||
Average temperature (°F)
7-Day Mean ending Jul 23, 2015
Source: NOAA/National Weather Service
Deviation between average and normal (°F)
7-Day Mean ending Jul 23, 2015
Source: NOAA/National Weather Service