In the News:
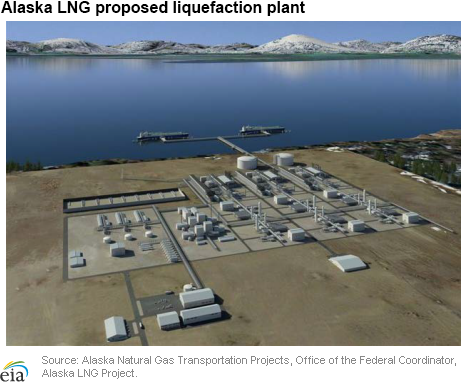
Alaskan LNG export project resumes operations
The existing liquefied natural gas (LNG) plant at Nikiski on the Kenai Peninsula in Alaska and a project to build a new liquefaction plant, also at Nikiski, both achieved major milestones recently. Last Friday, the first tanker since late 2012 arrived at ConocoPhillips's existing Kenai LNG plant, which is on Cook Inlet. Also, late last month, the Alaska Legislature passed a bill that paved the way for the state to take an equity interest in the new Alaska LNG project, which includes pipelines, alongside other partners, including ConocoPhillips, ExxonMobil, BP, and TransCanada. The project is expected to cost $45-$65 billion and is slated to begin operations in the mid-2020s.
Kenai LNG originally opened in 1969 and was the largest LNG export facility in the world at the time, and the first facility to serve the Asia-Pacific market. Annual exports from the plant peaked in 1996 at 67.6 billion cubic feet (Bcf), and up until March 2011, exports from the facility were sold to Tokyo Electric Power Company (Tepco) and Tokyo Gas Company, working together, under a long-term contract. As southern Alaska supplies of natural gas dwindled, total exports for 2011 and 2012 averaged just 12.9 Bcf per year, with the facility exporting its last cargo in October 2012. The export license expired in March 2013. Utilities and the state became concerned about the low gas supply, and with new investment to spur production in the Cook Inlet area, ConocoPhillips on April 14 received a new export license from the U.S. Department of Energy that allows it to export up to 40 Bcf of gas over the next 2 years. The Kenai facility provides storage capacity to help balance demand loads and provides an additional market for local supplies. By allowing producers to access markets outside southern Alaska, the facility gives producers an added incentive to explore for and produce additional resources. On April 20 the Alaska Legislature amended several existing state laws, thus enabling the state to move forward with negotiations for a new LNG liquefaction project to be built in Nikiski, along with storage tanks and a marine tanker terminal. This project would also include the construction of a 58-mile pipeline from the Point Thomson gas field on the North Slope to Prudhoe Bay, a gas processing plant at Prudhoe Bay to remove carbon dioxide from the gas stream, and an 800-mile, 42-inch-diameter pipeline to flow North Slope natural gas south to Nikiski, delivering some gas to Alaskans as well. In the North Slope, Prudhoe Bay alone is estimated to have in excess of 35 trillion cubic feet (Tcf) of proved natural gas reserves associated with oil production. The Potential Gas Committee of the Colorado School of Mines estimated that as of 2012, Alaska held 251 Tcf of unproved gas resources, including 57 Tcf of coalbed methane. The state has been negotiating with ConocoPhillips, ExxonMobil, BP, and TransCanada on plans for the Nikiski project, and the recently passed law was a major initiative of Alaska's governor. The state would receive 20% to 25% of the gas produced to supply the project as payment for taxes and royalties, and would take a corresponding equity interest in the natural gas processing plant and the LNG export plant, allowing it to market its share of the gas and give the proceeds to the state treasury. TransCanada would take a share in the pipeline on behalf of the state, and lease the corresponding capacity back to the state, providing it a means to transport its gas without having to make any capital investments in the pipeline. The project partners will start work on a pre-front-end engineering and design (pre-FEED) study this year that will help the partners determine the technical aspects, costs, and schedule for the project. Initial plans call for exports of 2 Bcf to 2.4 Bcf per day of gas (730 to 876 Bcf per year), with a final investment decision to be made possibly before 2020; exports could begin 5 to 6 years later.Overview:
(For the Week Ending Wednesday, May 7, 2014)
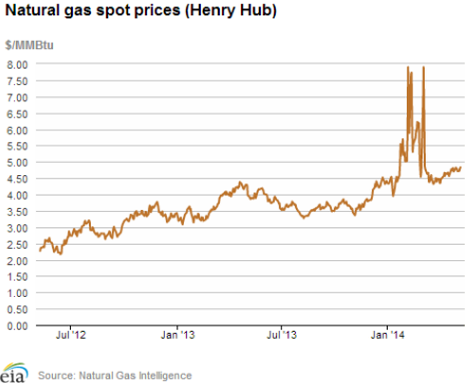
- Natural gas spot prices were generally flat for the report period, moving by a few cents in some locations. The Henry Hub spot rose by 5 cents, moving from $4.78 per million British thermal units (MMBtu) last Wednesday to $4.83 yesterday.
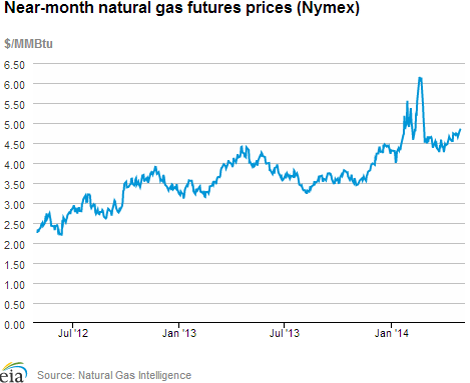
- At the New York Mercantile Exchange (Nymex), the June contract fell by more than 7 cents, beginning the report week at $4.815/MMBtu last Wednesday and settling at $4.740/MMBtu yesterday.
- Working natural gas in storage rose to 1,055 Bcf as of Friday, May 2, according to the U.S. Energy Information Administration (EIA) Weekly Natural Gas Storage Report (WNGSR). A net storage injection of 74 Bcf for the week resulted in storage levels 43.0% below year-ago levels and 48.2% below the 5-year average.
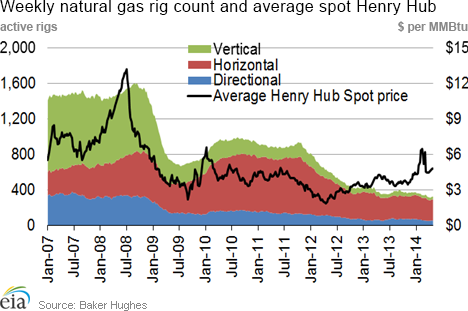
- Active oil and natural gas drilling rigs totaled 1,854 as of May 2, down by 7 rigs from the previous week, according to data from Baker Hughes Inc. The natural gas rig count was flat at 323, and the number of oil-directed rigs decreased by 7 to 1,527. The oil rig count is currently 124 higher than this week last year, and the gas rig count is 31 lower.
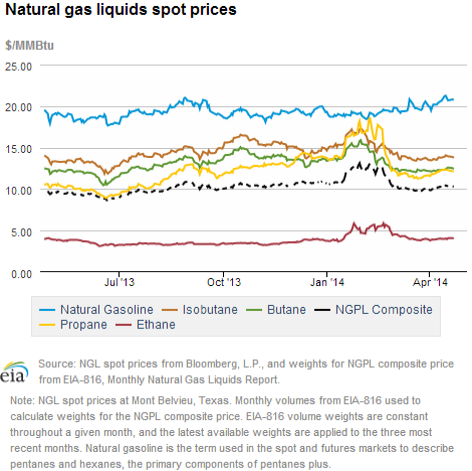
- The weekly average natural gas plant liquids composite price decreased again this week (covering April 28 through May 2), falling 2.0% from $10.31/MMBtu to $10.10/MMBtu. The Mont Belvieu spot prices of ethane, propane, butane, and natural gasoline drove the decline, falling by between 1% and 3%. The isobutane spot price was flat.
- Working natural gas in storage rose to 1,055 Bcf as of Friday, May 2, according to the U.S. Energy Information Administration (EIA) Weekly Natural Gas Storage Report (WNGSR). A net storage injection of 74 Bcf for the week resulted in storage levels 43.0% below year-ago levels and 48.2% below the 5-year average.
Prices/Demand/Supply:
Natural gas spot prices are flat to down slightly. On moderating weather and ample natural gas supply, most locations were flat or posted modest price declines for the week. The Henry Hub spot price was an exception, rising by 5 cents, moving from $4.78/MMBtu last Wednesday to $4.83 yesterday. In the Northeast, prices fell over the week and are generally below the Henry Hub price, even those delivering to major population centers. The Algonquin Citygate price delivering to Boston fell by just under a dime, from $4.52/MMBtu to $4.43, and Transco Zone 6 delivering to New York City fell by just under a nickel, from $4.23/MMBtu to $4.19. Spot prices at Leidy, which is one of the trading locations that are considered a reflection for the price of Marcellus natural gas, fell sharply from $4.09/MMBtu to $3.57, trading at an average discount of 94 cents to Henry Hub over the week.
In the West, the Malin price for delivery into southern Oregon fell from $4.73/MMBtu last Wednesday to $4.65 yesterday. In the Rockies, the Opal price for delivery in Wyoming fell from $4.67/MMBtu on Wednesday to $4.61 yesterday. And in the Midwest, the Chicago Citygate price fell from $4.89/MMBtu to $4.78 over the report period.
Nymex price falls slightly. At the New York Mercantile Exchange (Nymex), the June contract declined, beginning the week at $4.815/MMBtu last Wednesday and settling at $4.740 yesterday. The 12-month strip (the average of the June 2014 through May 2015 contracts) similarly fell, moving from $4.882/MMBtu last Wednesday to $4.796 yesterday.
Ethane exports begin. Throughout 2013 and so far in 2014, the price of spot ethane has been on average below that of natural gas. This has been caused by the rapid increase in natural gas plant liquids production and the lag in development of ethane demand. Favorably priced ethane has caused new ethane-consuming petrochemical facilities to begin development, some of which have come online, and for the first time in more than two decades, the United States is exporting ethane to Canada. Despite this, demand for ethane is still well below potential supply. Large volumes of ethane are being left in the natural gas stream by gas processors, a phenomenon known as ethane rejection.
Ethane is gaseous at standard temperature and pressure, and requires pipelines or chilled, high-pressure tanks to transport, in some ways similar to natural gas. As a result, ethane is a much less fungible product than propane or crude oil, and new supply is not as easily absorbed. Because of substantial sunk costs associated with creating new ethane demand, ethane purchase contracts may commit parties for long durations.
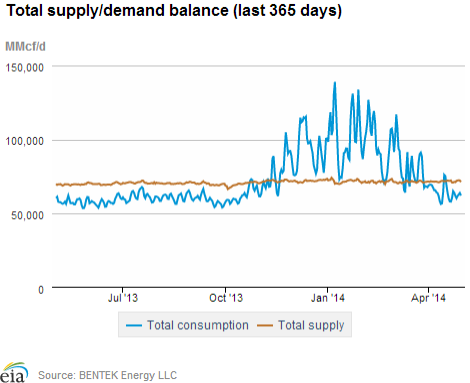
Natural gas supply increases slightly. According to Bentek Energy data, overall supply increased by 0.3% compared to last week. A small decrease in production (0.1%) was offset by an increase in imports from Canada (7.8%). Total imports from Canada were driven up largely on increased imports in the Midwest. In the Northeast, the United States exported small net volumes of gas to Canada over the report week.
Consumption declines. Bentek data show overall demand falling by 4.1% over the report period. With moderating shoulder season weather, residential and commercial consumption decreased by 14.9%, and industrial consumption fell by 0.7%. These decreases were partially offset by increases in exports to Mexico, which climbed by 4.0%, and electric-sector consumption, which rose by 4.7%.
Reversing the previous week's large increase, electric-sector consumption in the Pacific Northwest fell by 24.3%. The largest volumetric increase in electric-sector gas consumption was in Texas, where it rose by 11.9%. Electric-sector consumption in the Midwest rose by 70.4%, attracting import volumes from Canada.
Storage
Net storage injection exceeds average. The net injection reported for the week ending May 2 was 74 Bcf, 2 Bcf larger than the 5-year average net injection of 72 Bcf, but 7 Bcf smaller than last year's net injection of 81 Bcf. Working gas inventories totaled 1,055 Bcf, 797 Bcf (43.0%) less than last year at this time, 982 Bcf (48.2%) below the 5-year (2009-13) average, and 732 Bcf (41.0%) below the 5-year observed minimum.
Storage build is slightly larger than market expectations. Market expectations called for a build of 71 Bcf. When the EIA storage report was released at 10:30 a.m., the price for the June natural gas futures contract fell 9 cents to $4.60/MMBtu on the Nymex. Prices continued trading around that level in the hour following the release.
From the week ending on April 4 to the week ending on May 2, net storage injections have totaled 233 Bcf. The average unit value of what storage holders put into storage was $4.70/MMBtu, 11% higher than the average value for the same five weeks last year, of $4.22/MMBtu, when injections totaled 178 Bcf. The highest winter month Nymex price in trading yesterday was January, which settled at $4.934/MMBtu. This is 19 cents more than the Nymex June contract price yesterday. For the same storage week last year, which ended on May 3, 2013, the difference between the maximum winter contract and the front-month contract was 22 cents/MMBtu.
There are currently 26 more weeks in the injection season, which traditionally occurs April 1 through October 31. In order to reach EIA's forecasted end of October working natural gas inventory level of 3,405 Bcf, an average injection of 90 Bcf per week will need to occur through the end of October. EIA's forecast for the end of October inventory levels are below the 5-year (2009-13) minimum value of 3,792 Bcf. To reach the 5-year minimum, average weekly injections through the end of October would need to be 105 Bcf.
Two regions post larger-than-average builds. The East, West, and Producing regions had net injections of 35 Bcf (7 Bcf smaller than its 5-year average injection of 42 Bcf), 12 Bcf (3 Bcf larger than its 5-year average injection of 9 Bcf), and 27 Bcf (7 Bcf larger than its 5-year average injection of 20 Bcf), respectively. Storage levels for all three regions remain below their year-ago and 5-year average levels, and their 5-year minimums.
Temperatures during the storage report week cooler than normal. Temperatures in the Lower 48 states averaged 56.7 degrees for the week, 0.3 degree cooler than the 30-year normal temperature and 1.6 degrees cooler than during the same period last year.
See also:

| Spot Prices ($/MMBtu) | Thu, 01-May |
Fri, 02-May |
Mon, 05-May |
Tue, 06-May |
Wed, 07-May |
|---|---|---|---|---|---|
| Henry Hub |
4.78 |
4.71 |
4.72 |
4.79 |
4.83 |
| New York |
4.13 |
3.95 |
4.13 |
4.12 |
4.19 |
| Chicago |
4.89 |
4.80 |
4.78 |
4.81 |
4.78 |
| Cal. Comp. Avg,* |
5.04 |
4.88 |
4.97 |
4.98 |
4.98 |
| Futures ($/MMBtu) | |||||
| June Contract |
4.719 |
4.674 |
4.688 |
4.799 |
4.740 |
| July Contract |
4.750 |
4.704 |
4.715 |
4.818 |
4.750 |
| *Avg. of NGI's reported prices for: Malin, PG&E citygate, and Southern California Border Avg. | |||||
| Source: NGI's Daily Gas Price Index | |||||
| U.S. Natural Gas Supply - Gas Week: (4/30/14 - 5/7/14) | ||
|---|---|---|
Percent change for week compared with: |
||
last year |
last week |
|
| Gross Production | 4.09%
|
-0.14%
|
| Dry Production | 4.05%
|
-0.14%
|
| Canadian Imports | 1.30%
|
7.82%
|
| West (Net) | -0.92%
|
2.37%
|
| MidWest (Net) | 0.02%
|
31.65%
|
| Northeast (Net) | -65.78%
|
-118.24%
|
| LNG Imports | -84.34%
|
-73.01%
|
| Total Supply | 3.62%
|
0.27%
|
| Source: BENTEK Energy LLC | ||
| U.S. Consumption - Gas Week: (4/30/14 - 5/7/14) | ||
|---|---|---|
Percent change for week compared with: |
||
last year |
last week |
|
| U.S. Consumption | 2.8%
|
-4.1%
|
| Power | 9.8%
|
4.7%
|
| Industrial | -0.4%
|
-0.7%
|
| Residential/Commercial | -0.5%
|
-14.9%
|
| Total Demand | 2.9%
|
-3.9%
|
| Source: BENTEK Energy LLC | ||
| Rigs | |||
|---|---|---|---|
Fri, May 02, 2014 |
Change from |
||
last week |
last year |
||
| Oil Rigs | 1,527 |
-0.46% |
8.84% |
| Natural Gas Rigs | 323 |
0.00% |
-8.76% |
| Miscellaneous | 4 |
0.00% |
-42.86% |
| Rig Numbers by Type | |||
|---|---|---|---|
Fri, May 02, 2014 |
Change from |
||
last week |
last year |
||
| Vertical | 396 |
-0.50% |
-16.63% |
| Horizontal | 1,247 |
0.16% |
14.19% |
| Directional | 211 |
-3.21% |
7.11% |
| Source: Baker Hughes Inc. | |||
| Working Gas in Underground Storage | ||||
|---|---|---|---|---|
Stocks billion cubic feet (bcf) |
||||
| Region | 2014-05-02 |
2014-04-25 |
change |
|
| East | 397 |
362 |
35 |
|
| West | 203 |
191 |
12 |
|
| Producing | 455 |
428 |
27 |
|
| Total | 1,055 |
981 |
74 |
|
| Source: U.S. Energy Information Administration | ||||
| Working Gas in Underground Storage | |||||
|---|---|---|---|---|---|
Historical Comparisons |
|||||
Year ago (5/2/13) |
5-year average (2009-2013) |
||||
| Region | Stocks (Bcf) |
% change |
Stocks (Bcf) |
% change |
|
| East | 749 |
-47.0 |
870 |
-54.4 |
|
| West | 343 |
-40.8 |
322 |
-37.0 |
|
| Producing | 761 |
-40.2 |
844 |
-46.1 |
|
| Total | 1,852 |
-43.0 |
2,037 |
-48.2 |
|
| Source: U.S. Energy Information Administration | |||||
| Temperature -- Heating & Cooling Degree Days (week ending May 01) | ||||||||
|---|---|---|---|---|---|---|---|---|
HDD deviation from: |
CDD deviation from: |
|||||||
| Region | HDD Current |
normal |
last year |
CDD Current |
normal |
last year |
||
| New England | 125
|
23
|
28
|
0
|
0
|
0
|
||
| Middle Atlantic | 99
|
14
|
18
|
0
|
0
|
0
|
||
| E N Central | 93
|
3
|
22
|
0
|
-1
|
-3
|
||
| W N Central | 108
|
29
|
34
|
1
|
-3
|
-3
|
||
| South Atlantic | 34
|
-3
|
-15
|
37
|
14
|
17
|
||
| E S Central | 25
|
-9
|
-20
|
13
|
3
|
6
|
||
| W S Central | 19
|
7
|
0
|
41
|
9
|
8
|
||
| Mountain | 101
|
11
|
29
|
6
|
-6
|
-12
|
||
| Pacific | 44
|
-9
|
20
|
11
|
6
|
6
|
||
| United States | 72
|
5
|
15
|
14
|
3
|
4
|
||
|
Note: HDD = heating degree-day; CDD = cooling degree-day Source: National Oceanic and Atmospheric Administration | ||||||||
Average temperature (°F)
7-Day Mean ending May 01, 2014
Source: NOAA/National Weather Service
Deviation between average and normal (°F)
7-Day Mean ending May 01, 2014
Source: NOAA/National Weather Service