In the News:
Power sector response to high natural gas prices varies by region
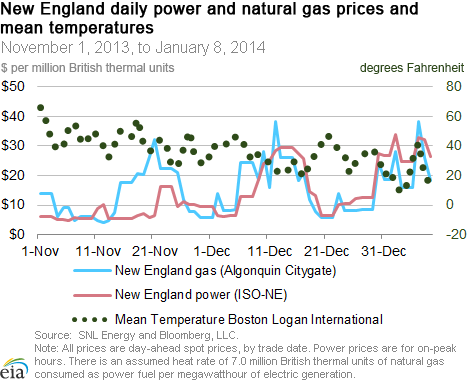
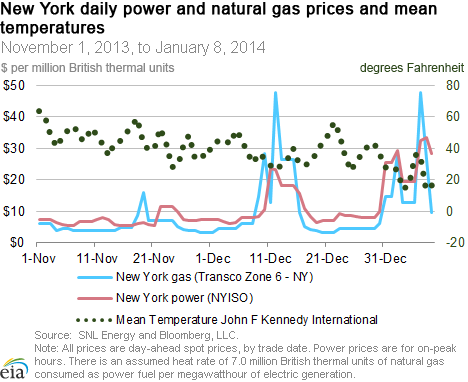
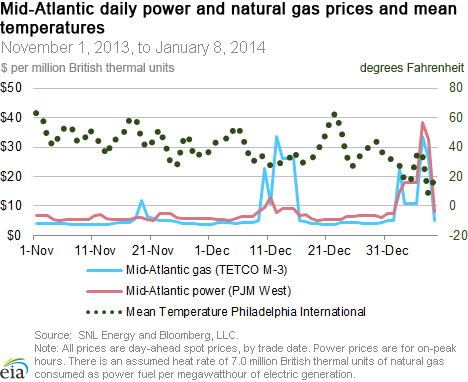
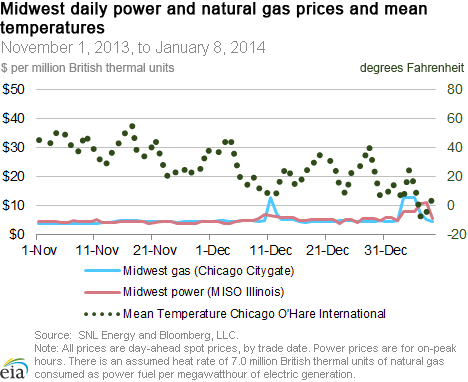
Day-ahead spot prices for natural gas and electric generation rose this week in both the Midwest and eastern United States, as the polar vortex brought cold temperatures to those parts of the country. While cold temperatures affected all of these regions, both gas and power prices increased more in New England, New York and the Mid-Atlantic than they did in the Midwest.
Gas-fired power plants in the East had to compete for an increasingly limited amount of available pipeline capacity from a system that was already constrained, particularly in New England and New York. Firm capacity reserved for heating homes and businesses pushed up the premium that generators must pay for remaining gas available on the spot market, causing an increase in oil-fueled electric generation in New York and New England. Gas prices are generally greater in New England than New York or the Mid-Atlantic during cold weather. However, an unplanned outage on January 7 at the Delmont Compressor Station in western Pennsylvania on the Texas Eastern Transmission Company's (Tetco) Penn Jersey Line meant that gas prices in the Mid-Atlantic and New York reached levels comparable to those of New England on that date.
The high natural gas prices also translated into high power prices in New England, New York, and the Mid-Atlantic. In New York and New England, power prices are more sensitive to changes in natural gas prices largely because gas-fired electric generation plays a more significant role in meeting power demand increases. Natural gas-fueled power in the Northeast accounted for 42% of its total net generation in 2013, versus 17% in the Mid-Atlantic and 10% in the central region. While coal-fired power accounted for more than twice as much net generation in the Mid-Atlantic as gas-fired power, gas-fired power appears to satisfy a much greater portion of incremental demand, leading to similar power prices there during cold weather.
By contrast, in the central United States, where coal-fired power accounts for approximately two-thirds of total net generation, the impact of gas prices on power prices is much more limited. On January 3, when spot gas prices in New England, New York, the Mid-Atlantic, and Midwest were all between $10-$16/MMBtu, spot power prices in New England, New York, and the Mid-Atlantic all climbed above $17/MMBtu ($119 per megawatthour (MWh)), more than double the spot power price in Illinois of $8/MMBtu ($56.15/MWh). Power plant outages also contributed to high power prices in the East.
Overview:
(For the Week Ending Wednesday, January 8, 2014)
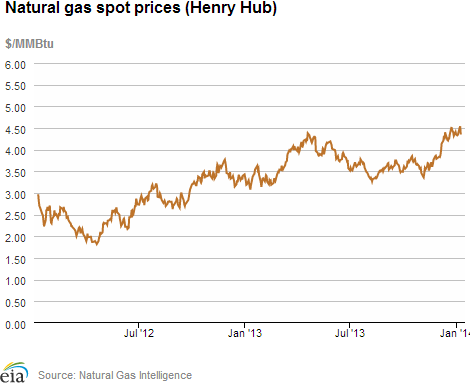
- Natural gas spot prices increased at most locations during the report week in response to extremely high weather-driven demand. The Henry Hub spot price posted a slight overall from $4.33/million British thermal unit (MMBtu) last Thursday, January 2, to $4.35/MMBtu yesterday, with an increase up to $4.54/MMBtu in the middle of the report week. Regional price variations were much more pronounced, with some Northeast prices rising to greater than $70/MMBtu in trading Monday.
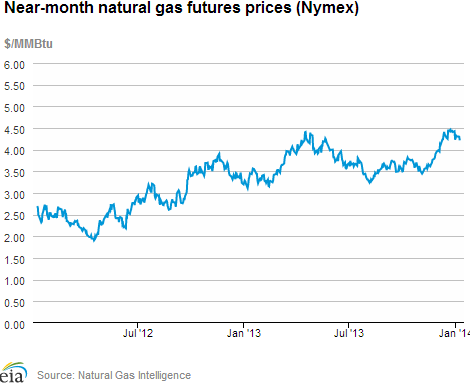
- At the New York Mercantile Exchange, the February 2014 contract fell from $4.321/MMBtu last Thursday to $4.216/MMBtu yesterday.
- Working natural gas in storage decreased to 2,817 Bcf as of Friday, January 3, according to the EIA Weekly Natural Gas Storage Report (WNGSR). Stocks declined by 157 Bcf for the week. Storage levels are 15.1% below year-ago levels and 10.1% below the 5-year average.
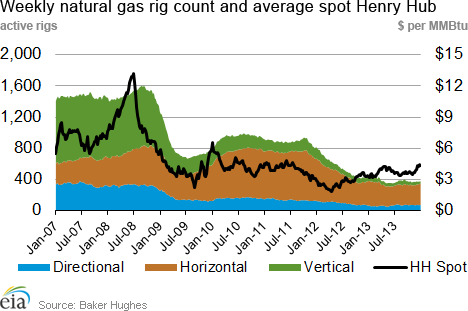
- The natural gas rotary rig count totaled 372 as of Friday, January 3, according to data released by Baker Hughes Inc. This represents a decline of 2 rigs from the previous week. The oil rig count fell by 4 units to 1378. Total rigs come to 1,751, compared to 1,762 a year ago.
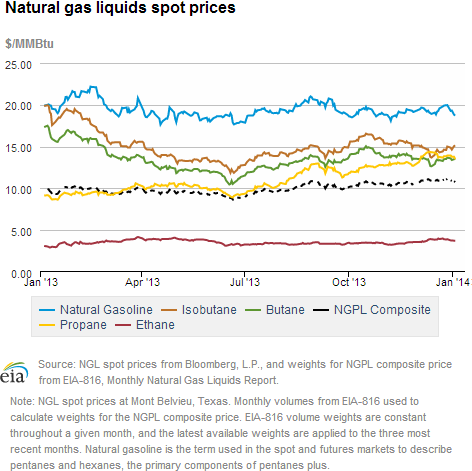
- The weekly average natural gas plant liquids composite price fell 1.6% this week (covering December 30 through January 3) compared to the previous week, and is now at $10.87/MMBtu. Natural gasoline and ethane drove the decrease in the composite price, falling by 4.4% and 4.2%, respectively, over this period. Isobutane increased by 1.8%, while butane increased by 0.1%, and propane decreased by 0.5%.
Prices/Demand/Supply:
Polar vortex sends prices to new highs. In the Northeast, extremely cold temperatures led to high demand. In conjunction with existing pipeline constraints, that resulted in record-high prices. Texas Eastern Pipeline declared a force majeure following an unplanned outage at a compressor station on its M3 line in western Pennsylvania, and many pipelines in the region issued critical notices and operational flow orders (OFO) to prevent imbalances. In particular, Transcontinental Pipeline, which extends from Texas to New York City, issued a systemwide OFO on Monday. Prices on Transcontinental Pipeline's Zone 5 (which serves Mid-Atlantic customers) averaged $72.43/MMBtu on Monday, January 6, an increase of more than $60/MMBtu from the previous day. Prices for that location came close to $100/MMBtu during intraday trading on Monday. On the same day, other prices on Transco's system reached $70.66/MMBtu for Zone 6 Non-NY, which serves New Jersey and Pennsylvania, and $56.59/MMBtu on Zone 6's segment serving New York City.
At the Algonquin Citygate, Monday prices averaged $34.14/MMBtu, and other New England prices were in the mid-$30/MMBtu range. While still very high, the price spikes in New England were not as severe as they were in New York. Cold weather and pipeline outages curtailed New York's access to pipeline gas from the nearby Marcellus Shale. In contrast, New England has access to liquefied natural gas (LNG) sendout from the Distrigas LNG terminal in Everett, Massachusetts, as well as both LNG and offshore production brought south from Canada on the Maritimes & Northeast Pipeline. New England also has utility-owned, above-ground LNG storage facilities. These additional sources of supply helped mitigate price increases in New England. By the end of the week, prices in both regions remained elevated but had backed off their mid-week highs.
Midwest prices reach unusual levels. Temperatures in the Midwest were some of the coldest in the country, with wind chills reaching far below zero on Monday and Tuesday. With a wind chill of -40 on Monday, Chicago was colder than parts of Siberia, earning it the nickname "Chiberia" from residents. Prices at the Chicago Citygate normally are very close to Henry Hub prices; however, in trading Friday, prices rose to $13.97/MMBtu (compared with prices in the $4.30s at Henry), before dropping back to $4.70/MMBtu at the end of the report week. Both ANR Pipeline and NGPL, major interstate pipelines that flow natural gas to the Midwest, issued OFOs, and many other pipelines in the region issued critical notices that curtailed normal gas-flow scheduling to maintain balance on their systems.
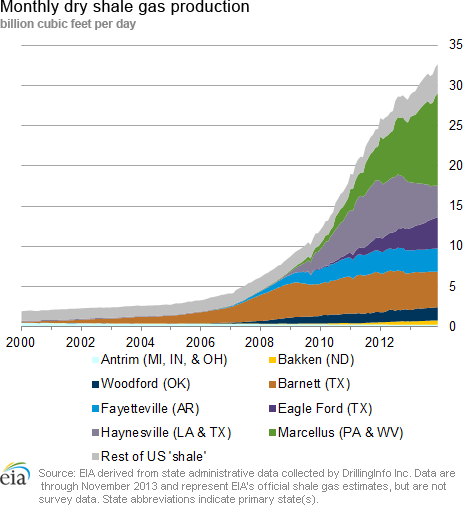
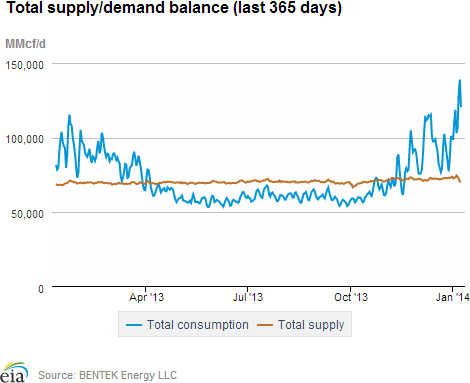
Production drops to September 2012 levels. According to Bentek Energy, the cold temperatures led to widespread freeze-offs, particularly in the Fayetteville Shale and northeast Pennsylvania. Bentek also reported production declines in the Haynesville Shale. Dry production dropped to 61.9 Bcf/d on Tuesday, its lowest level since September 2012, before partially rebounding in the following days. This resulted in a decline of 2.7% in dry production, but overall supply during the week declined only 0.6%, as increased imports from Canada to the Northeast and Midwest United States helped to offset losses in production. LNG sendout also increased from the previous week to help meet winter demand.
Consumption spikes. Total consumption hit its highest daily level in Bentek's history (which goes back to 2005) on Monday, at 128.7 Bcf, then hit another record high at 137.0 Bcf on Tuesday as the cold weather moved from the Midwest to the East. Residential and commercial demand increased 38% from the previous week. Consumption of natural gas for power generation (power burn) rose 35.5% week on week, and was greater than 30 Bcf/d on both Monday and Tuesday. Though this was not a record, power burn is not normally this high during the winter, and these levels are much more typical of levels seen in the summer months. Industrial consumption rose 6.1% week-on-week, and overall consumption rose 29.8% from last week.
Nymex price falls a dime. The near-month (February 2014) futures contract fell from $4.321/MMBtu last Thursday to $4.216/MMBtu yesterday. Similarly, the 12-month strip (the average of the 12 contracts between February 2014 and January 2015) fell from $4.266/MMBtu January 2 to $4.143/MMBtu yesterday.
Storage
Gas storage sees a larger-than-average net withdrawal. The net withdrawal reported for the week ending January 3 was 157 Bcf, 26 Bcf larger than the 5-year average, but smaller than last year's net withdrawal of 191 Bcf. Current inventories totaling 2,817 Bcf are 528 Bcf (15.8%) less than last year at this time, and 315 Bcf (10.1%) below the 5-year (2009-13) average. This is the first week that the 5-year average shifts to include 2013.
Net withdrawal was in line with market expectations of 155 Bcf. When the EIA storage report was released, there was a 2-cent increase in prices for natural gas futures on the New York Mercantile Exchange. At 10:30 a.m., the price of the near-month (February 2014) contract increased to $4.18/MMBtu, but fell lower than the prestorage report release price within minutes. Prices were trading at around $4.11/MMBtu in the hour following.
Net withdrawal in the East and Producing Region are larger than average. The largest withdrawals occurred in the East and Producing regions, which had net withdrawals of 98 Bcf and 42 Bcf, respectively. The West region had a net withdrawal of 17 Bcf. All three gas storage regions remain below their year-ago and 5-year average levels.
Temperatures during the storage report week are slightly warmer than normal. Temperatures in the Lower 48 states averaged 34.9 degrees for the week, 1.0 degrees warmer than the 30-year normal temperature and 3.2 degrees warmer than the same period last year.
See also:
| Spot Prices ($/MMBtu) | Thu, 2-Jan |
Fri, 3-Jan |
Mon, 6-Jan |
Tue, 7-Jan |
Wed, 8-Jan |
|---|---|---|---|---|---|
| Henry Hub | 4.33 |
4.34 |
4.50 |
4.54 |
4.35 |
| New York | 30.58 |
13.82 |
56.59 |
28.66 |
9.46 |
| Chicago | 4.85 |
13.97 |
7.49 |
5.39 |
4.70 |
| Cal. Comp. Avg,* | 4.48 |
4.57 |
4.85 |
4.72 |
4.50 |
| Futures ($/MMBtu) | |||||
| February Contract | 4.321 |
4.304 |
4.306 |
4.299 |
4.216 |
| March Contract | 4.296 |
4.282 |
4.284 |
4.267 |
4.175 |
*Avg. of NGI's reported prices for: Malin, PG&E citygate, and Southern California Border Avg. |
| Source: NGI's Daily Gas Price Index | |||||
| Spot Prices ($/MMBtu) | Thu, 26-Dec |
Fri, 27-Dec |
Mon, 30-Dec |
Tue, 31-Dec |
Wed, 1-Jan |
|---|---|---|---|---|---|
| Henry Hub | 4.40 |
4.32 |
4.41 |
4.35 |
Holiday |
| New York | 4.56 |
4.51 |
6.05 |
13.62 |
Holiday |
| Chicago | 4.69 |
4.78 |
4.87 |
4.77 |
Holiday |
| Cal. Comp. Avg,* | 4.47 |
4.49 |
4.54 |
4.44 |
Holiday |
| Futures ($/MMBtu) | |||||
| January Contract | 4.433 |
4.407 |
Expired |
Expired |
Holiday |
| February Contract | 4.476 |
4.368 |
4.427 |
4.230 |
Holiday |
| March Contract | 4.441 |
4.336 |
4.382 |
4.193 |
Holiday |
| *Avg. of NGI's reported prices for: Malin, PG&E citygate, and Southern California Border Avg. | |||||
| Source: NGI's Daily Gas Price Index | |||||
| Spot Prices ($/MMBtu) | Thu, 19-Dec |
Fri, 20-Dec |
Mon, 23-Dec |
Tue, 24-Dec |
Wed, 25-Dec |
|---|---|---|---|---|---|
| Henry Hub | 4.26 |
4.35 |
4.52 |
4.46 |
Holiday |
| New York | 4.05 |
3.51 |
4.64 |
4.65 |
Holiday |
| Chicago | 4.53 |
4.76 |
4.92 |
4.84 |
Holiday |
| Cal. Comp. Avg,* | 4.48 |
4.53 |
4.61 |
4.50 |
Holiday |
| Futures ($/MMBtu) | |||||
| January Contract | 4.460 |
4.418 |
4.463 |
4.416 |
Holiday |
| February Contract | 4.489 |
4.467 |
4.519 |
4.469 |
Holiday |
| *Avg. of NGI's reported prices for: Malin, PG&E citygate, and Southern California Border Avg. | |||||
| Source: NGI's Daily Gas Price Index | |||||
| U.S. Natural Gas Supply - Gas Week: (1/1/14 - 1/8/14) | ||
|---|---|---|
Percent change for week compared with: |
||
last year |
last week |
|
| Gross Production | 1.03%
|
-2.75%
|
| Dry Production | 1.02%
|
-2.72%
|
| Canadian Imports | 40.33%
|
16.96%
|
| West (Net) | 17.76%
|
-11.31%
|
| MidWest (Net) | 101.53%
|
45.38%
|
| Northeast (Net) | 14.17%
|
47.15%
|
| LNG Imports | 13.52%
|
92.84%
|
| Total Supply | 4.12%
|
-0.59%
|
| Source: BENTEK Energy LLC | ||
| U.S. Consumption - Gas Week: (1/1/14 - 1/8/14) | ||
|---|---|---|
Percent change for week compared with: |
||
last year |
last week |
|
| U.S. Consumption | 24.1%
|
29.5%
|
| Power | 18.7%
|
35.5%
|
| Industrial | 6.1%
|
6.1%
|
| Residential/Commercial | 34.5%
|
38.0%
|
| Total Demand | 23.7%
|
29.8%
|
| Source: BENTEK Energy LLC | ||
| Rigs | |||
|---|---|---|---|
Fri, January 03, 2014 |
Change from |
||
last week |
last year |
||
| Oil Rigs | 1,378 |
-0.29% |
4.55% |
| Natural Gas Rigs | 372 |
-0.53% |
-15.26% |
| Miscellaneous | 1 |
0.00% |
-80.00% |
| Rig Numbers by Type | |||
|---|---|---|---|
Fri, January 03, 2014 |
Change from |
||
last week |
last year |
||
| Vertical | 377 |
-2.58% |
-21.46% |
| Horizontal | 1,148 |
0.17% |
3.24% |
| Directional | 226 |
0.89% |
32.94% |
| Source: Baker Hughes Inc. | |||
| Working Gas in Underground Storage | ||||
|---|---|---|---|---|
Stocks billion cubic feet (bcf) |
||||
| Region | 1/3/14
|
12/27/13
|
change |
|
| East | 1,403 |
1,501 |
-98
|
|
| West | 395 |
412 |
-17
|
|
| Producing | 1,019 |
1,061 |
-42
|
|
| Total | 2,817 |
2,974 |
-157
|
|
| Source: U.S. Energy Information Administration | ||||
| Working Gas in Underground Storage | |||||
|---|---|---|---|---|---|
Historical Comparisons |
|||||
Year ago (1/3/13) |
5-year average (2009-2013) |
||||
| Region | Stocks (Bcf) |
% change |
Stocks (Bcf) |
% change |
|
| East | 1,702 |
-17.6 |
1,642 |
-14.6 |
|
| West | 482 |
-18.0 |
430 |
-8.1 |
|
| Producing | 1,161 |
-12.2 |
1,059 |
-3.8 |
|
| Total | 3,345 |
-15.8 |
3,132 |
-10.1 |
|
| Source: U.S. Energy Information Administration | |||||
| Temperature -- Heating & Cooling Degree Days (week ending Jan 02) | ||||||||
|---|---|---|---|---|---|---|---|---|
HDD deviation from: |
CDD deviation from: |
|||||||
| Region | HDD Current |
normal |
last year |
CDD Current |
normal |
last year |
||
| New England | 267
|
5
|
7
|
0
|
0
|
0
|
||
| Middle Atlantic | 242
|
-8
|
-5
|
0
|
0
|
0
|
||
| E N Central | 292
|
7
|
6
|
0
|
0
|
0
|
||
| W N Central | 336
|
27
|
8
|
0
|
0
|
0
|
||
| South Atlantic | 161
|
-16
|
-14
|
10
|
3
|
7
|
||
| E S Central | 184
|
0
|
-16
|
0
|
-1
|
0
|
||
| W S Central | 153
|
16
|
-17
|
0
|
-2
|
0
|
||
| Mountain | 210
|
-26
|
-73
|
0
|
0
|
0
|
||
| Pacific | 84
|
-42
|
-77
|
0
|
0
|
0
|
||
| United States | 213
|
-6
|
-21
|
2
|
1
|
1
|
||
|
Note: HDD = heating degree-day; CDD = cooling degree-day Source: National Oceanic and Atmospheric Administration | ||||||||
Average temperature (°F)
7-Day Mean ending Jan 02, 2014
Source: NOAA/National Weather Service
Deviation between average and normal (°F)
7-Day Mean ending Jan 02, 2014
Source: NOAA/National Weather Service