In the News:
EIA Projects Natural Gas Production Will Exceed Consumption by 2020
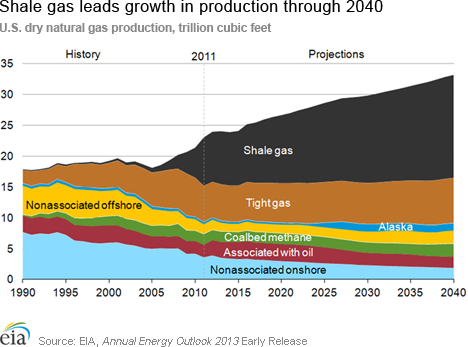
The U.S. Energy Information Administration (EIA) released the early release version of its 2013 Annual Energy Outlook (AEO2013), which includes projections for U.S. energy markets through 2040 under reference case assumptions. Projections under the reference case include only current laws and policies. The full AEO, which includes side cases, will be available in spring 2013.
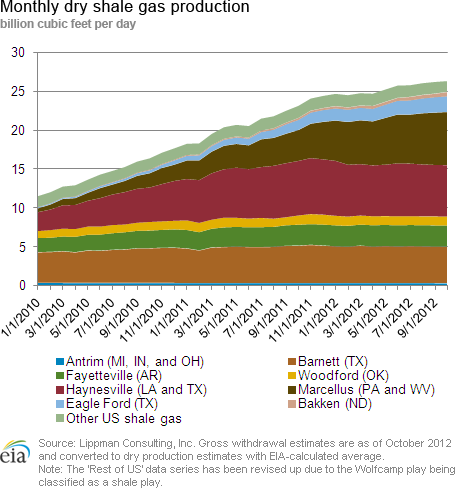
The AEO2013 projects strong growth in natural gas production, led by continued development of shale resources. Despite growth in natural gas consumption, AEO2013 projects that the United States will become a net exporter of natural gas by the year 2020—two years earlier and with greater volumes of U.S. natural gas exports than was projected in the Annual Energy Outlook 2012.
Domestic natural gas consumption grows by about 21 percent from 2011 to 2040. Consumption grows most in the electric power and industrial sectors, which are better positioned to benefit from relatively low natural gas prices. Increased use of liquefied natural gas (LNG) for heavy-duty vehicles contributes to growth of natural gas use in the transportation sector, which represents 6 percent of natural gas consumption in 2040, compared with 3 percent in 2011.
Overview:
(For the Week Ending Wednesday, December 5, 2012)
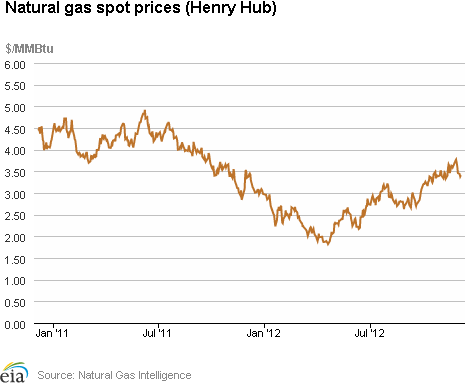
- Natural gas prices registered overall decreases for the report week (Wednesday to Wednesday) at many of the country's trading locations. The Henry Hub price declined steadily throughout most of the reporting period, closing yesterday at $3.41 per million British thermal units (MMBtu), down 29 cents per MMBtu for the week.
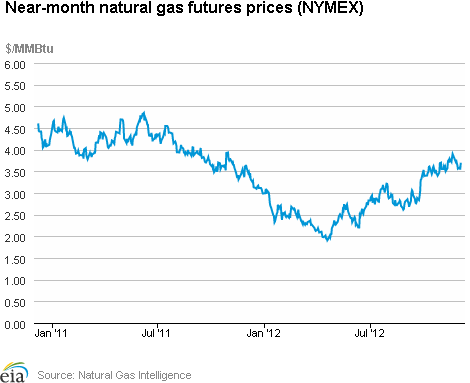
- The natural gas futures market trended lower over most of the week. At the New York Mercantile Exchange (NYMEX), the January 2012 natural gas contract lost 10.1 cents per MMBtu overall to close at $3.700 per MMBtu yesterday.
- Working natural gas in storage declined last week to 3,804 billion cubic feet (Bcf) as of Friday, November 30, according to EIA's Weekly Natural Gas Storage Report (WNGSR). An implied storage withdrawal of 73 Bcf for the week positioned storage volumes 33 Bcf below year-ago levels.
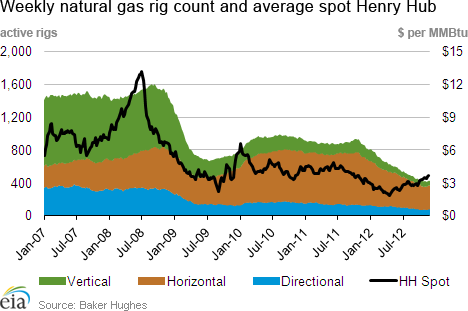
- The natural gas rotary rig count, as reported by Baker Hughes Incorporated on November 30, decreased by 4 to 424 active units. Meanwhile, oil-directed rigs fell by 2 to 1,386 units.
Prices:
The Henry Hub day-ahead price registered an overall decrease for the week, dropping 32 cents per MMBtu through Tuesday before regaining some ground yesterday to close the week at $3.41 per MMBtu, down 7.8 percent. Generally higher-than-average temperatures in many locations helped to lower prices early in the report week, with prices finishing the week higher in some locations ahead of forecasts of colder weather.
At the NYMEX, the January 2013 contract ended the week lower, dropping from $3.801 per MMBtu last Wednesday to $3.700 per MMBtu yesterday, a decrease of 10.1 cents per MMBtu. Prices fell for much of the report week before regaining more than 16 cents per MMBtu yesterday, finishing the week down 2.7 percent. The 12-Month Strip (average of January 2013 to December 2013 contracts) closed yesterday at $3.823 per MMBtu, down 3.2 cents per MMBtu (0.8 percent) for the week.
Certain locations in the Northeast saw prices initially trending significantly lower as very warm weather late in the report week followed seasonally colder temperatures. Prices rebounded toward the end of the week ahead of a return to colder weather. For example, at the Algonquin Citygate trading point (for delivery into Boston), spot prices started the report week at $9.78 per MMBtu and rose 20 cents per MMBtu on Thursday, but dropped to $4.76 per MMBtu on Monday (as temperatures approached 60 degrees) before rebounding sharply on Tuesday and again yesterday, closing at $9.43 per MMBtu (down 3.6 percent for the week). Similarly, prices at the Transcontinental Pipeline's Zone 6 trading point (serving New York City markets), which began the week at $5.40 per MMBtu, fell nearly $1.00 per MMBtu on Thursday, and continued a steady decline through Tuesday before regaining ground yesterday, finishing the report week at $4.34 per MMBtu (down 19.6 percent).
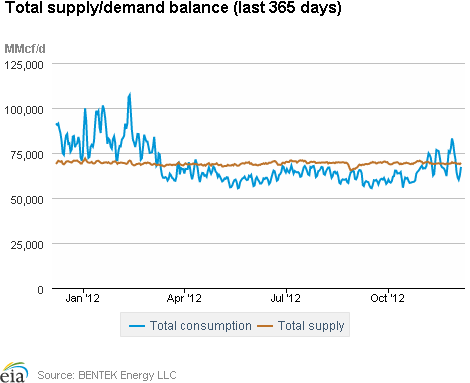
Total consumption for the report week registered an overall decrease, reflecting lower demand across all sectors. According to estimates from BENTEK Energy LLC (Bentek), domestic natural gas consumption fell by 11.9 percent from last week, driven by a decrease of 23.5 percent in residential/commercial sector consumption. Industrial sector consumption finished the week down 2.1 percent, while power sector consumption dipped modestly (down 0.2 percent). Residential/commercial sector consumption trailed levels for the same week last year by a considerable margin (24.7 percent).
Total supply was unchanged for the week, largely reflecting essentially flat dry natural gas production. According to Bentek estimates, domestic weekly dry natural gas production declined 0.6 percent from the previous week's volumes (while remaining 0.5 percent higher than the same period last year). Imports from Canada rose by 7.4 percent, with all regions showing increased shipments, particularly the Midwest, up 25.1 percent. For the week, imports from Canada stand moderately below year-ago volumes (down 5.2 percent). While liquefied natural gas (LNG) sendout rose 25.3 percent over last week, sendout volumes remain well below (62.6 percent) year-ago levels.
Storage
Working natural gas in storage decreased to 3,804 Bcf as of Friday, November 30, according to EIA's WNGSR. This represents an implied net withdrawal of 73 Bcf from the previous week, the third and largest withdrawal for this heating season. This week's net withdrawal was 22 Bcf larger than the 5-year (2007-2011) average net withdrawal of 51 Bcf, and 59 Bcf larger than last year's withdrawal of 14 Bcf. Inventories are currently 33 Bcf (0.9 percent) less than last year at this time and 168 Bcf (4.6 percent) greater than the 5-year average.
All three storage regions posted decreases this week. Inventories in the East, West, and Producing regions decreased by 56 Bcf (the 5-year average net withdrawal is 35 Bcf), 3 Bcf (the 5-year average net withdrawal is 7 Bcf), and 14 Bcf (the 5-year average net withdrawal is 9 Bcf), respectively. In the Producing region, working natural gas inventories increased 1 Bcf (0.3 percent) in salt cavern facilities and decreased 13 Bcf (1.3 percent) in nonsalt cavern facilities.
Temperatures during the storage report week were 0.4 degree cooler than the 30-year normal temperature and 5.9 degrees cooler than the same period last year. Temperatures in the Lower 48 states averaged 41.7 degrees, compared to 47.6 last year and the 30-year normal of 42.1 degrees. While slightly below normal overall, temperatures varied somewhat across Census divisions. In the South, the South Atlantic and East South Central Census divisions were relatively cool, averaging 4.3 and 3.9 degrees, respectively, cooler than the 30-year normal. In the West, the Mountain and Pacific Census divisions were particularly warm, averaging 6.9 and 4.1 degrees warmer than the 30-year normal. Heating degree-days nationwide were 1.2 percent above normal and 32.3 percent above last year.
See also:
| Spot Prices ($/MMBtu) | Thu, 29-Nov |
Fri, 30-Nov |
Mon, 03-Dec |
Tue, 04-Dec |
Wed, 05-Dec |
|---|---|---|---|---|---|
| Henry Hub | 3.61 |
3.46 |
3.44 |
3.38 |
3.41 |
| New York | 4.43 |
3.87 |
3.70 |
3.65 |
4.34 |
| Chicago | 3.72 |
3.57 |
3.53 |
3.44 |
3.48 |
| Cal. Comp. Avg,* | 3.79 |
3.61 |
3.63 |
3.55 |
3.69 |
| Futures ($/MMBtu) | |||||
| January Contract | 3.648 |
3.561 |
3.591 |
3.539 |
3.700 |
| February Contract | 3.668 |
3.584 |
3.615 |
3.562 |
3.720 |
| *Avg. of NGI's reported prices for: Malin, PG&E citygate, and Southern California Border Avg. | |||||
| Source: NGI's Daily Gas Price Index | |||||
| U.S. Natural Gas Supply - Gas Week: (11/28/12 - 12/5/12) | ||
|---|---|---|
Percent change for week compared with: |
||
last year |
last week |
|
| Gross Production | 0.47%
|
-0.62%
|
| Dry Production | 0.47%
|
-0.61%
|
| Canadian Imports | -5.24%
|
7.41%
|
| West (Net) | -16.03%
|
0.84%
|
| MidWest (Net) | -11.04%
|
25.10%
|
| Northeast (Net) | 32.00%
|
4.21%
|
| LNG Imports | -62.57%
|
25.25%
|
| Total Supply | -0.49%
|
-0.04%
|
| Source: BENTEK Energy LLC | ||
| U.S. Consumption - Gas Week: (11/28/12 - 12/5/12) | ||
|---|---|---|
Percent change for week compared with: |
||
last year |
last week |
|
| U.S. Consumption | -13.97%
|
-11.92%
|
| Power | -5.75%
|
-0.19%
|
| Industrial | -2.63%
|
-2.09%
|
| Residential/Commercial | -24.67%
|
-23.51%
|
| Total Demand | -13.62%
|
-11.58%
|
| Source: BENTEK Energy LLC | ||
| Rigs | |||
|---|---|---|---|
Fri, November 30, 2012 |
Change from |
||
last week |
last year |
||
| Oil Rigs | 1,386 |
-0.14% |
22.44% |
| Natural Gas Rigs | 424 |
-0.93% |
-50.47% |
| Miscellaneous | 1 |
0.00% |
-80.00% |
| Rig Numbers by Type | |||
|---|---|---|---|
Fri, November 30, 2012 |
Change from |
||
last week |
last year |
||
| Vertical | 508 |
-0.20% |
-18.06% |
| Horizontal | 1,110 |
-0.36% |
-3.98% |
| Directional | 193 |
-0.52% |
-11.06% |
| Source: Baker Hughes Inc. | |||
| Working Gas in Underground Storage | ||||
|---|---|---|---|---|
Stocks billion cubic feet (bcf) |
||||
| Region | 11/30/12
|
11/23/12
|
change |
|
| East | 1,986 |
2,042 |
-56
|
|
| West | 545 |
548 |
-3
|
|
| Producing | 1,273 |
1,287 |
-14
|
|
| Total | 3,804 |
3,877 |
-73
|
|
| Source: U.S. Energy Information Administration | ||||
| Working Gas in Underground Storage | |||||
|---|---|---|---|---|---|
Historical Comparisons |
|||||
Year ago (11/30/11) |
5-year average (2007-2011) |
||||
| Region | Stocks (Bcf) |
% change |
Stocks (Bcf) |
% change |
|
| East | 2,063 |
-3.7 |
2,002 |
-0.8 |
|
| West | 517 |
5.4 |
491 |
11.0 |
|
| Producing | 1,257 |
1.3 |
1,143 |
11.4 |
|
| Total | 3,837 |
-0.9 |
3,636 |
4.6 |
|
| Source: U.S. Energy Information Administration | |||||
| Temperature -- Heating & Cooling Degree Days (week ending Nov 29) | ||||||||
|---|---|---|---|---|---|---|---|---|
HDD deviation from: |
CDD deviation from: |
|||||||
| Region | HDD Current |
normal |
last year |
CDD Current |
normal |
last year |
||
| New England | 202
|
14
|
79
|
0
|
0
|
0
|
||
| Middle Atlantic | 196
|
17
|
84
|
0
|
0
|
0
|
||
| E N Central | 224
|
18
|
65
|
0
|
0
|
0
|
||
| W N Central | 245
|
13
|
62
|
0
|
0
|
0
|
||
| South Atlantic | 147
|
24
|
57
|
4
|
-6
|
-5
|
||
| E S Central | 153
|
26
|
35
|
0
|
-1
|
0
|
||
| W S Central | 83
|
-9
|
-16
|
3
|
-1
|
1
|
||
| Mountain | 153
|
-46
|
-7
|
2
|
2
|
2
|
||
| Pacific | 72
|
-30
|
-8
|
0
|
-1
|
0
|
||
| United States | 164
|
2
|
40
|
1
|
-1
|
-1
|
||
|
Note: HDD = heating degree-day; CDD = cooling degree-day Source: National Oceanic and Atmospheric Administration | ||||||||
Average temperature (°F)
7-Day Mean ending Nov 29, 2012
Source: NOAA/National Weather Service
Deviation between average and normal (°F)
7-Day Mean ending Nov 29, 2012
Source: NOAA/National Weather Service