In the News:
In the News: Canaport LNG Undergoing Maintenance.
Canaport LNG, an LNG import terminal located in St. John, New Brunswick, Canada, began planned maintenance on May 1. Most of the natural gas delivered from the terminal is transported to the United States via pipeline. The maintenance is expected to last up to 16 days, and since it began, flows have been negligible. The maintenance on the terminal's compression system is expected to reduce emissions from the site.
The reduction in flows from Canaport since the beginning of the month underlies the substantial decrease in Canadian pipeline imports to the Northeast this week compared to last week, according to data from BENTEK Energy LLC (Bentek). Additionally, before the planned maintenance, flows from Canaport were at a reduced level, accounting for part of a year-over-year decrease in net imports to the Northeast in 2012. Reduced net pipeline imports from Canada to the Northeast is likely the result of both the warm 2011-2012 winter, which reduced demand for natural gas for space heating, and the reduced LNG shipments to Canaport. Comparatively low North American natural gas prices have likely contributed to a decline in LNG imports (as cargoes can receive higher prices in other markets). This has also affected the Everett LNG terminal in New England, where imports have declined this year.
Overview:
(For the Week Ending Wednesday, May 9, 2012)
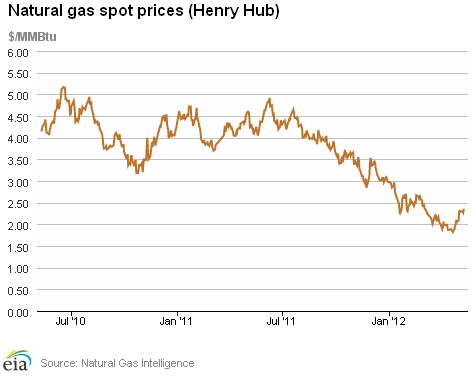
- Natural gas prices remained above $2.00 per million British thermal units (MMBtu) over the report week (Wednesday to Wednesday) at most trading locations across the country. The Henry Hub price closed within a 9 cent range, settling at $2.36 per MMBtu yesterday (up 5 cents for the week).
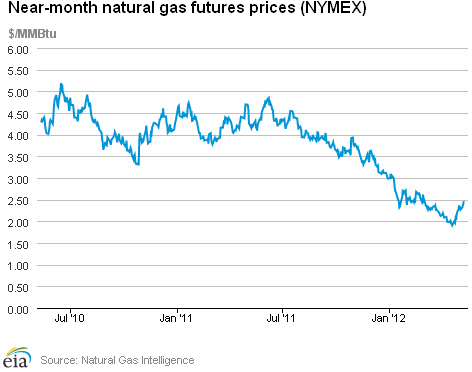
- The natural gas futures market generally trended higher over the week. At the New York Mercantile Exchange (NYMEX), the June 2012 natural gas contract gained 21.2 cents per MMBtu to close at $2.465 per MMBtu yesterday.
- Working natural gas in storage rose slightly last week to 2,606 billion cubic feet (Bcf) as of Friday, May 4, according to EIA's Weekly Natural Gas Storage Report (WNGSR). An implied storage build of 30 Bcf for the week positioned storage volumes 799 Bcf above year-ago levels.
- The natural gas rotary rig count, as reported by Baker Hughes Incorporated on May 4, declined by 7 to 606 active units, 32 percent lower than the same week last year. Meanwhile, oil-directed rigs increased by 27 to 1,355 units, 45 percent above the same week last year.
Prices:
At the NYMEX, the June 2012 contract rose from $2.253 per MMBtu last Wednesday to $2.465 per MMBtu yesterday, an increase of 21.2 cents per MMBtu (9.4 percent). With the exception of a 3 percent drop on Friday, the contract rose steadily over the week. The 12-Month Strip (average of June 2012 through May 2013 contracts) followed a similar pattern with a 19.5 cent per MMBtu (6.8 percent) increase for the week.
With the exception of a strong gain yesterday, movement in the Henry Hub day-ahead price reflected a relatively flat cash market over the week. The price fluctuated between $2.27 and $2.31 per MMBtu between last Wednesday and this Tuesday and then gained 9 cents yesterday to close the week at $2.36 per MMbtu (up 2.2 percent).
Nearly all downstream trading locations showed daily single-digit price fluctuations for all but the last day of the report week. The Rocky Mountain Region was the exception, with many locations registering double digit drops last Thursday, due in part to a Kern River pipeline outage. After dropping almost 20 cents per MMBtu last Thursday, both the Kern River and Opal pricing points quickly recovered, with both points finishing the week up 5 cents per MMBtu (2.4 percent). Spot prices at Transcontinental Pipeline's Zone 6 trading point for delivery into New York City, which started the week at $2.58 per MMBtu, dropped 12 cents per MMBtu over the week to close at $2.46 per MMBtu (down 4.7 percent). Over the same period, the Chicago citygate spot price registered a 6 cent per MMBtu gain (from $2.32 per MMBtu last Wednesday), ending the week at $2.38 per MMBtu (up 2.6 percent).
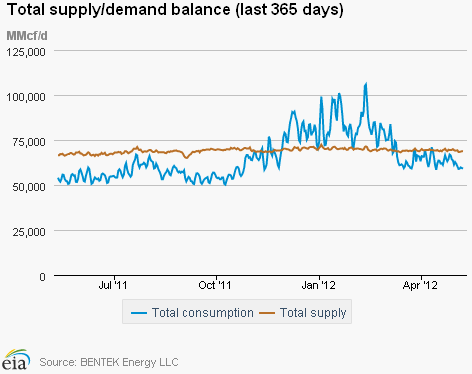
Total consumption for the report week registered an overall decrease, with an increase in power sector demand partially offsetting declines in other sectors. According to estimates from Bentek, domestic natural gas consumption fell by 7.1 percent from last week, driven by a 24.2 percent decline in residential/commercial sector consumption and a 2.7 percent decline in the industrial sector. Consumption increased in the power sector, which ended the week up 2.2 percent, 44 percent above last year's consumption for the same week.
Total supply was down 1.1 percent over the report week, with declines in all reported supply sources. According to Bentek estimates, domestic weekly dry gas production averaged 63.6 Bcf per day, 0.5 percent lower than the previous week and 4.1 percent above the same time last year. Imports from Canada averaged 4.9 Bcf per day, down 7.6 percent from the previous week and 3.4 percent below year-ago levels. Liquefied natural gas (LNG) sendout during the week, which averaged 242 MMcf per day, declined 14.3 percent and remains 60.7 percent below year-ago levels.
Storage
Working natural gas in storage increased to 2,606 Bcf as of Friday, May 4, according to EIA's WNGSR. This represents a net injection of 30 Bcf from the previous week. This week's injection was 54 Bcf lower than the 5-year (2007-2011) average injection for the same week. During the same week last year, the implied net injection was 71 Bcf. Working inventories are currently 799 Bcf (44 percent greater than their year-ago levels and 803 Bcf (45 percent) greater than the 5-year average.
Two of the three storage regions posted increases this week. Inventories in the East and West Regions increased by 24 Bcf and 8 Bcf, respectively, while in the Producing Region, inventories decreased slightly by 2 Bcf. In the Producing Region, working natural gas inventories decreased 8 Bcf in salt cavern facilities and increased 6 Bcf in nonsalt cavern facilities.
Temperatures in the lower 48 States during the week ending May 3 were 2.6 degrees warmer than the 30-year normal temperature and 3.3 degrees warmer than the same period last year. The average temperature in the lower 48 States was 60.3 degrees, 2.6 degrees higher than the 30-year normal of 57.7 degrees. While overall temperatures were a few degrees warmer than normal, temperatures varied somewhat across Census Divisions. The East South Central and West South Central Regions in the South were particularly warm, averaging 8.4 and 8.1 degrees, respectively, warmer than the 30-year normal. In the East, the New England and Middle Atlantic Regions were particularly cool, averaging 4.0 and 2.6 degrees cooler, respectively, than the 30-year normal.
See also:
Canaport and Northeast Pipeline Net Imports,
January 1, 2011 - May 6, 2012
MMcf/d
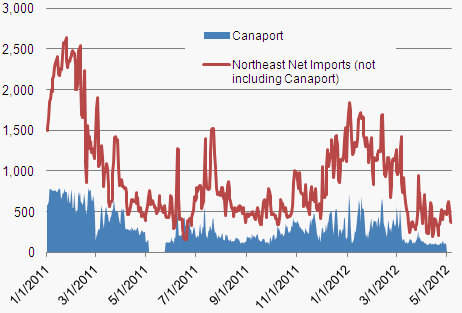
Source: Energy Information Administration
| Spot Prices ($/MMBtu) | Thu, 03-May |
Fri, 04-May |
Mon, 07-May |
Tue, 08-May |
Wed, 09-May |
|---|---|---|---|---|---|
| Henry Hub | 2.29 |
2.30 |
2.30 |
2.27 |
2.36 |
| New York | 2.52 |
2.42 |
2.41 |
2.37 |
2.46 |
| Chicago | 2.28 |
2.30 |
2.33 |
2.31 |
2.38 |
| Cal. Comp. Avg,* | 2.27 |
2.29 |
2.32 |
2.30 |
2.44 |
| Futures ($/MMBtu) | |||||
| June Contract | 2.340 |
2.279 |
2.336 |
2.393 |
2.465 |
| July Contract | 2.430 |
2.371 |
2.422 |
2.475 |
2.550 |
| *Avg. of NGI's reported prices for: Malin, PG&E citygate, and Southern California Border Avg. | |||||
| Source: NGI's Daily Gas Price Index | |||||
| U.S. Natural Gas Supply - Gas Week: (5/2/12 - 5/9/12) | ||
|---|---|---|
Percent change for week compared with: |
||
last year |
last week |
|
| Gross Production | 4.07%
|
-0.46%
|
| Dry Production | 4.09%
|
-0.46%
|
| Canadian Imports | -3.44%
|
-7.58%
|
| West (Net) | 0.03%
|
-5.79%
|
| MidWest (Net) | 2.14%
|
-6.43%
|
| Northeast (Net) | -32.45%
|
-19.67%
|
| LNG Imports | -60.70%
|
-14.31%
|
| Total Supply | 2.92%
|
-1.06%
|
| Source: BENTEK Energy LLC | ||
| U.S. Consumption - Gas Week: (5/2/12 - 5/9/12) | ||
|---|---|---|
Percent change for week compared with: |
||
last year |
last week |
|
| U.S. Consumption | 9.23%
|
-7.10%
|
| Power | 44.01%
|
2.23%
|
| Industrial | -1.10%
|
-2.72%
|
| Residential/Commercial | -16.74%
|
-24.19%
|
| Total Demand | 8.95%
|
-6.99%
|
| Source: BENTEK Energy LLC | ||
Weekly natural gas rig count and spot Henry Hub
active rigs$ per MMBtu
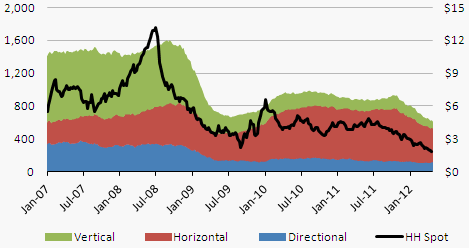
Source: Baker Hughes
| Rigs | |||
|---|---|---|---|
Fri, May 04, 2012 |
Change from |
||
last week |
last year |
||
| Oil Rigs | 1,355 |
2.03% |
45.07% |
| Natural Gas Rigs | 606 |
-1.14% |
-31.91% |
| Miscellaneous | 4 |
0.00% |
-66.67% |
| Rig Numbers by Type | |||
|---|---|---|---|
Fri, May 04, 2012 |
Change from |
||
last week |
last year |
||
| Vertical | 573 |
1.78% |
0.00% |
| Horizontal | 1,158 |
1.67% |
11.56% |
| Directional | 234 |
-3.70% |
4.00% |
| Source: Baker Hughes Inc. | |||
| Working Gas in Underground Storage | ||||
|---|---|---|---|---|
Stocks billion cubic feet (bcf) |
||||
| Region | 5/4/12
|
4/27/12
|
change |
|
| East | 1,189 |
1,165 |
24
|
|
| West | 379 |
371 |
8
|
|
| Producing | 1,038 |
1,040 |
-2
|
|
| Total | 2,606 |
2,576 |
30
|
|
| Source: U.S. Energy Information Administration | ||||
| Working Gas in Underground Storage | |||||
|---|---|---|---|---|---|
Historical Comparisons |
|||||
Year ago (5/4/11) |
5-year average (2007-2011) |
||||
| Region | Stocks (Bcf) |
% change |
Stocks (Bcf) |
% change |
|
| East | 736 |
61.5 |
789 |
50.7 |
|
| West | 238 |
59.2 |
275 |
37.8 |
|
| Producing | 833 |
24.6 |
739 |
40.5 |
|
| Total | 1,807 |
44.2 |
1,803 |
44.5 |
|
| Source: U.S. Energy Information Administration | |||||
| Temperature -- Heating & Cooling Degree Days (week ending May 03) | ||||||||
|---|---|---|---|---|---|---|---|---|
HDD deviation from: |
CDD deviation from: |
|||||||
| Region | HDD Current |
normal |
last year |
CDD Current |
normal |
last year |
||
| New England | 126
|
28
|
65
|
0
|
0
|
0
|
||
| Middle Atlantic | 98
|
17
|
37
|
0
|
-1
|
-2
|
||
| E N Central | 79
|
-6
|
-24
|
10
|
8
|
10
|
||
| W N Central | 53
|
-22
|
-55
|
14
|
9
|
14
|
||
| South Atlantic | 22
|
-13
|
-4
|
46
|
22
|
7
|
||
| E S Central | 5
|
-26
|
-33
|
46
|
33
|
35
|
||
| W S Central | 0
|
-11
|
-29
|
81
|
46
|
56
|
||
| Mountain | 65
|
-22
|
-52
|
15
|
2
|
7
|
||
| Pacific | 46
|
-5
|
4
|
0
|
-5
|
-4
|
||
| United States | 57
|
-6
|
-11
|
24
|
12
|
12
|
||
|
Note: HDD = heating degree-day; CDD = cooling degree-day Source: National Oceanic and Atmospheric Administration | ||||||||
Average temperature (°F)
7-Day Mean ending May 03, 2012
Source: NOAA/National Weather Service
Deviation between average and normal (°F)
7-Day Mean ending May 03, 2012
Source: NOAA/National Weather Service
Monthly dry shale gas production
billion cubic feet per day
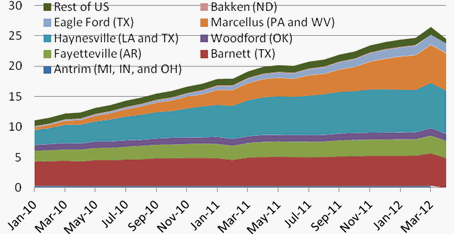
Source: Lippman Consulting, Inc. Gross withdrawal estimates are as of April 2012 and converted to dry production estimates with EIA-calculated average.