Natural Gas Weekly Update Text
Released: November 10, 2011 at 2:00 P.M.
Next Release: Thursday, November 17, 2011 |
|
|
|
|
Overview (For the Week Ending Wednesday, November 9, 2011)
|
|
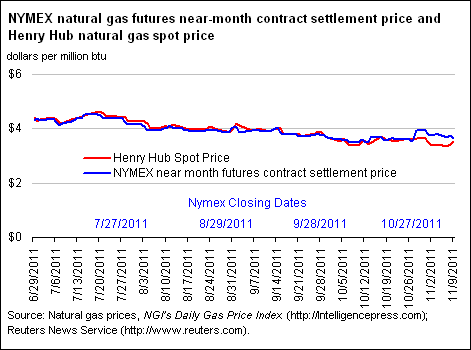
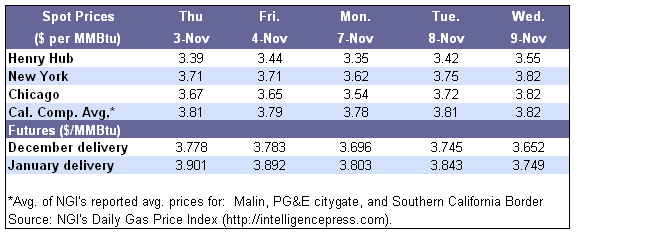
- Continuing its recent trend of languishing below the $4 per million Btu (MMBtu) mark, the Henry Hub natural gas spot price oscillated this week, and posted an overall net increase of 16 cents, from $3.39 per MMBtu last Wednesday, November 2, to $3.55 per MMBtu yesterday, November 9.
- At the New York Mercantile Exchange, the price of the near-month (December 2011) natural gas futures contract fell from $3.749 per MMBtu last Wednesday to $3.652 per MMBtu yesterday.
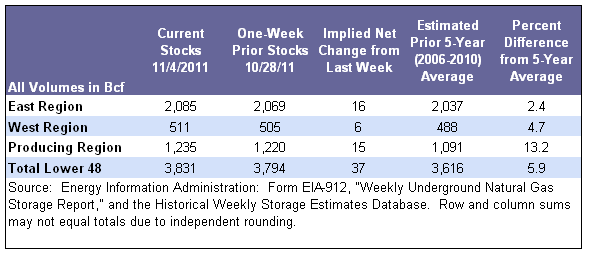
- Working natural gas in storage rose to 3,831 billion cubic feet (Bcf) as of Friday, November 4, according to EIA’s Weekly Natural Gas Storage Report (WNGSR).
- The natural gas rotary rig count, reported by Baker Hughes Incorporated on Friday, November 4, fell by 27 to 907. This decline reverses several weeks of a mostly upward trend and it is the largest single-week decline since April 2009.
|
|
|
 |
|
More Summary Data
|
|
| Prices |
|
|
Cash prices around much of the country, with a few exceptions, posted gains over the week. The Henry Hub price dropped overall from $3.39 per MMBtu last Wednesday to $3.55 yesterday, but movements during the week were mixed. On the last couple of days of trading in the report week, many pricing points around the country rallied slightly. The Henry Hub gained a total of 20 cents in these last two days.
Prices in New England were exceptions to the overall increase seen in spot prices. The Algonquin Citygate price, which serves as a proxy for prices in the Boston, Massachusetts area, fell from $4.19 per MMBtu last Wednesday to $4.03 per MMBtu yesterday. Similarly, prices on Tennessee Pipeline’s Zone 6 delivery points (which serve Connecticut, Massachusetts, Rhode Island, and New Hampshire) fell slightly over the report week. Outside of New England, however, Northeast prices rose, following the general trend of the rest of the country. At Transcontinental Pipeline’s Zone 6 delivery point serving New York City, prices rose from $3.59 per MMBtu last Wednesday to $3.82 per MMBtu yesterday.
For much of the week, the eastern part of the United States was warmer than normal, while the western part was cooler than normal. These temperature patterns boosted natural gas used for power burn in the Northeast, Midwest, and Southeast, and increased the use of natural gas used for residential and commercial heating in the Rockies and California regions. Southern California prices also reflected cooler temperatures, with the Southern California Citygate price rising from $3.71 per MMBtu last Wednesday to ¬¬$3.92 per MMBtu yesterday. The area warmed up near the end of the report week, however, and demand retreated. The Midwest was much warmer than normal, and Midwest power burn for the whole week reflected this, averaging almost 14 percent more than last week’s levels and 72 percent more than the same week last year.
Dry production was up about 0.4 percent this week, but declined somewhat near the end of the report week from levels greater than 64 Bcf per day from previously in the report week. The Independence Hub, an offshore natural gas production facility in the Gulf of Mexico, is currently offline for maintenance, removing close to 0.5 Bcf per day of natural gas from the Gulf. According to BENTEK Energy Services, LLC (BENTEK) estimates, this has brought Gulf of Mexico production to below 7 Bcf per day. However, BENTEK noted that companies were able to source gas from other regions of the country to maintain deliveries to consuming regions.
|
|
|
|
The NYMEX near-month (December 2011) contract lost 9.7 cents this week, falling from $3.749 per MMBtu last Wednesday to $3.652 per MMBtu yesterday. During its tenure as the near-month contract, which began on October 28, the December 2011 contract has lost 27.1 cents, or about 7 percent of its value. The 12-month strip (the average of the 12 contracts between December 2011 and November 2012) also fell this week, dropping from $3.945 per MMBtu last Wednesday to $3.825 per MMBtu yesterday.
This week, NYMEX prices entering the winter for the November 2011-March 2012 five-month strip reached their lowest levels seen since 2001-2002. Price expectations going into winter reached their highest point, at close to $12 per MMBtu, heading into the winter of 2005-2006, after Hurricanes Katrina and Rita caused natural gas supply disruptions in the Gulf of Mexico. In the past several years, however, as onshore lower 48 production has grown substantially, particularly in shale formations, winter price expectations have moderated.
|
|
|
|
More Price Data
|
|
| Storage |
|
|
Working natural gas in storage rose to 3,831 Bcf as of Friday, November 4, according to EIA’s WNGSR (see Storage Figure). This represents an implied net injection of 37 Bcf. Though October 31 each year is the official end of the injection season, storage builds often continue into November. In fact, the 5-year (2006 – 2010) averages for both November 4 and November 11 are positive, a net injection of 23 Bcf and 10 Bcf, respectively. Last year during the same week, working natural gas inventories rose 26 Bcf. Current inventories are 6 Bcf lower than their year-ago levels, and 215 Bcf above the 5-year average. Storage inventories are currently 16 Bcf below the all-time monthly high of 3,847 Bcf, which was recorded for the month of October 2010.
The Producing Region is the only region where stocks are above last year’s levels. Working inventories in this region total 1,235 Bcf, 4 Bcf more than year-ago levels. Inventories in the East and West Regions, however, are close to their year-ago levels, falling only 2 Bcf and 8 Bcf short, respectively. Stocks are above the 5-year average in all three of the storage regions.
Temperatures during the week ending November 3 were about 2.1 degrees cooler than the 30-year normal temperature level (see Temperature Maps and Data). Most Census Divisions were cooler than normal, with exceptions in the West North Central and the Pacific Census Divisions. Compared with the same week last year, overall temperatures in the United States were 2.3 degrees cooler.
|
|
 |
|
More Storage Data |
|
Other Market Trends |
|
Utica Shale Attracts Infrastructure Investment. Recently Caiman Energy announced it would build two short pipelines under the Ohio River to bring “wet” (liquids rich) natural gas from the Utica Shale in Ohio to the company’s processing plant in Marshall County, West Virginia. The company will commit $30 million, and such infrastructure investment is another sign of the importance of natural gas liquids in driving domestic production. The Utica Shale is located in the Northeast, and is situated about 8,000 feet below the surface of the Earth, and underneath the Marcellus shale. The Utica is primarily located beneath Pennsylvania, West Virginia, New York, and Ohio, which has recently been a major area of investment and interest. While currently, oil and natural gas production out of the State of Ohio remains small, several companies have made substantial investments, and permitting in the State (specifically in the eastern part of the State, where the Utica shale is located) has expanded. Some key developments and facts:
|
|
- On Friday, November 4, Schlumberger Limited’s Smith Bits STATS group reported that there were 16 active natural gas rigs in the state of Ohio.
- In October, 25 drilling permits were issued by the Ohio Department of Natural Resources. This was a record number of permits issued in a single month.
- Chesapeake is among the largest investor, having recently purchased a stake of 1.25 million acres of land. Other major players in the region include Hess Corporation, Chevron, CONSOL Energy, and Enervest.
|
Short-Term Energy Outlook Projects Continued Natural Gas Supply Growth. EIA released the Short-Term Energy Outlook (STEO) on November 8, with projections through the end of 2012. The latest STEO is also presented in a new, redesigned, interactive format. Among natural gas highlights this month:
|
|
- EIA expects U.S. marketed natural gas production to average 65.6 Bcf per day in 2011, and 66.9 Bcf per day in 2012. All of the growth in production results from increases in onshore production, which more than offset continuing declines from the Gulf of Mexico.
- Projected total natural gas consumption averages 67.1 Bcf per day in 2011, and 67.9 Bcf per day in 2012. Residential and commercial consumption are expected to increase in 2012 from their 2011 levels, mirroring the increase in heating degree-days.
- EIA expects that working natural gas inventories will total about 1.8 trillion cubic feet (Tcf) at the end of March 2012, the end of the winter heating season, with net withdrawals during the period totaling 0.3 Tcf less than last year. The projected value would be the highest end-of-March inventory level since 1991.
- Henry Hub natural gas spot prices are expected to average $4.09 per MMBtu in 2011. EIA expects prices to rise slightly to $4.13 per MMBtu in 2012.
|
See Weekly Natural Gas Storage Report for additional Natural Gas Storage Data.
See Natural Gas Analysis for additional Natural Gas Reports and Articles.
See Short-Term Energy Outlook for additional Natural Gas Prices, Supply, and Demand.
|
| |
|