Natural Gas Weekly Update Text
Released: April 28, 2011 at 2:00 P.M.
Next Release: Thursday, May 5, 2011 |
|
|
|
|
Overview (For the Week Ending Wednesday, April 27, 2011)
|
|
- Mild temperatures coupled with continued strong domestic production resulted in natural gas cash market prices dropping modestly at nearly all domestic pricing points over the week. The lone exception was the Henry Hub price which rose a token 2 cents per million Btu (MMBtu) (0.5 percent) to $4.35 per MMBtu on April 27.
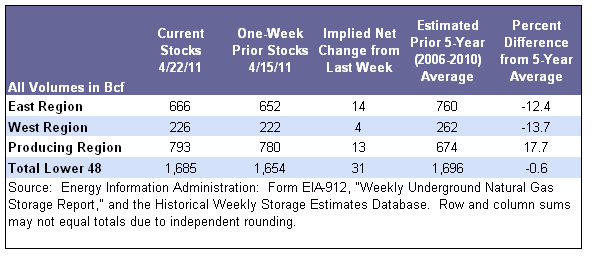
- Working natural gas in storage rose to 1,685 billion cubic feet (Bcf) as of Friday, April 22, according to the U.S. Energy Information AdministrationÆs (EIA) Weekly Natural Gas Storage Report (WNGSR). The implied increase for the week was 31 Bcf, with storage volumes positioned 215 Bcf below year-ago levels.
- At the New York Mercantile Exchange (NYMEX), the expiring May 2011 natural gas contract price ended 6.7 cents above the previous Wednesday, reaching $4.377 per MMBtu after peaking late last week.
- The natural gas rotary rig count, as reported April 21 by Baker Hughes Incorporated, dropped by 7 to 878 active units. Oil-directed rigs now outnumber gas-directed rigs for the first time since 1995.
|
|
|
 |
|
More Summary Data
|
|
| Prices |
|
|
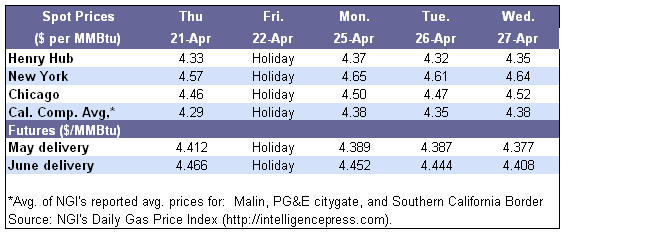
Prevailing downstream natural gas prices resumed their gradual decline during the week. The New York citygate was reflective of pricing points showing an overall loss for the week dropping from a level of $4.72 per MMBtu last Wednesday to $4.64 per MMBtu yesterday. The Chicago citygate was also representative of the general weekly trend and eased from $4.59 per MMBtu the previous Wednesday to $4.52 per MMBtu yesterday. The only pricing exception occurred earlier in the week at Henry Hub and in Florida where a passing warm front triggered some incremental gas-fired cooling load and temporary price increases.
|
|
|
|
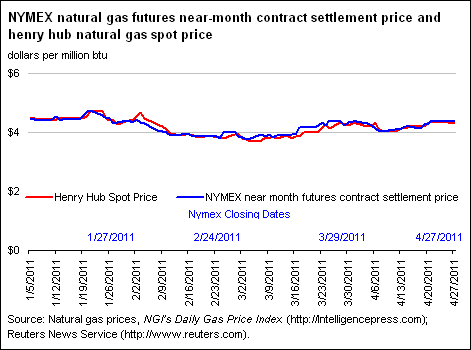
At the NYMEX, the price of the expiring May 2011 contract increased a token 6.7 cents (1.6 percent) over the week from $4.310 per MMBtu to $4.377 per MMBtu after peaking late last week. However, the NYMEX price has declined in 4 of the last trading sessions.
The Henry Hub price defied the general trend in a slightly oversupplied market rising 0.5 percent from $4.33 per MMBtu and ending the week up slightly at $4.35 per MMBtu. The Henry Hub cash price turned what was to have been a 1 cent weekly loss into a 2 cent gain on Wednesday with a late 3 cent price surge.
Overall moderating natural gas consumption, primarily due to milder weather during the week, was likely the prime catalyst causing softening natural gas prices. According to estimates from BENTEK Energy Services, LLC, domestic gas consumption decreased this week by 5.4 percent from last week. A large drop in natural gas consumption by the residential/commercial sector of 11.9 percent (weather inspired) led the decrease. This was followed by a drop of 2.2 percent in the industrial sector that largely offset a 2.4 percent increase in the power sector.
According to BENTEK estimates, the weekÆs average total nominal gas supply represented an increase of 1.0 percent from last weekÆs value. Domestic weekly gas production averaged 64.1 Bcf per day, up 0.5 percent, which countered a drop in Canadian imports. Production has been above 64 Bcf per day for 5 of the past 7 days. Canadian imports averaged just above 6.0 Bcf per day, representing a slight decline from last week, and now stand 8.8 percent below year-ago levels. Supply also picked up in the liquefied natural gas (LNG) arena, where imports increased to over 1.3 Bcf per day due to a plant performance test being conducted last week.
|
|
|
|
More Price Data
|
|
| Storage |
|
|
Working natural gas in storage rose to 1,685 Bcf as of Friday, April 22, according to EIAÆs WNGSR (see Storage Figure). The 31-Bcf net injection was relatively small and has sent stocks below the 5-year (2006-2010) average of 1,696 Bcf after finishing slightly above average the week before. The build was considerably less than last yearÆs build of 81 Bcf, leaving stocks 215 Bcf below last yearÆs level of 1,900 Bcf.
Regional storage differences are continuing with relatively low stocks in the East and West Regions partially offset by high stocks in the Producing Region. While stocks in the East and West Regions are 94 Bcf and 36 Bcf below the 5-year average respectively, the Producing Region is 119 Bcf above average and even 70 Bcf above last yearÆs high levels.
Temperatures in the lower 48 States during the week ending April 21 averaged 53.9 degrees, the same as the average temperature but 1.7 degrees cooler than last year. The National Weather ServiceÆs degree-day data show that temperatures were below average in the upper Midwest and New England but above average in most other regions (see Temperature Maps and Data). Gas weighted heating degree days were about 6 percent higher than normal for the week because the relatively cool temperatures were seen in high gas consuming regions. The West South Central Region saw the highest relative temperatures at 4.0 degrees above normal, while the West North Central Region was the coldest relative to normal at 6.6 degrees below the historical average.
|
|
 |
|
More Storage Data |
|
Other Market Trends |
|
Rig Count Falls to 878. The natural gas rotary rig count fell by 7 to 878 last week, according to data released April 21 by Baker Hughes Incorporated. This is the third consecutive week that natural gas directed rigs have fallen. For the same week, oil rigs rose by 33 to 913, and for the first time since 1995 outnumbered natural gas rigs. Oil rigs have risen 19 percent from the beginning of 2011, while natural gas rigs have fallen about 4 percent. Horizontal rigs (including both oil and natural gas) rose to 1,020 this week, an increase of 17 from the previous week, and are at a high for the 20 years for which Baker Hughes has data available. Directional rigs fell by 4 for the week to 213, while vertical rigs increased by 15.
EIA Releases Full Annual Energy Outlook. On April 26, EIA released the full Annual Energy Outlook 2011, with forecasts for energy supply and demand through 2035. In December 2010, EIA released an early version of the AEO, including only the reference case, a ōbusiness-as-usualö scenario assuming baseline economic growth. The full version includes 57 sensitivity cases, including scenarios for high and low economic growth, high and low oil prices, and more. Additionally, the reference case released in December has been updated to incorporate modeling changes and changes in legislation and regulation. The full version of the AEO is available at: http://www.eia.doe.gov/forecasts/aeo/index.cfm
|
|
|
|
| |
|
Natural Gas Transportation Update |
|
- A harbinger of the upcoming cooling season occurred this week as forecasts of hot temperatures in Florida resulted in Florida Gas Transmission Company, LLC notifying customers of expected demand increases from electric power generators meeting air conditioning needs. The pipeline company reminded customers of the need to balance receipt and deliveries on its system, and set a 20-percent tolerance for negative daily imbalances (greater takes than deliveries). The notice was contained in a Daily Overage Alert to shippers.
- Southern Star Central Gas Pipeline, Inc. on Tuesday, April 26, announced that it had expanded operations at its Elk City Storage Facility, increasing deliverability by 40 million cubic feet (MMcf) per day and storage capacity by 4 Bcf. According to the company, customers are contracted for all of the expanded capacity and deliverability. Southern Star now operates a total of 47 Bcf of storage capacity.
- Texas Eastern Transmission Company (TETCO) reminded shippers of upcoming maintenance on its Philadelphia Lateral near Chester, Pennsylvania. To comply with the applicable Federal regulatory requirements, the pipeline company will be conducting in-line inspection tool runs on the Lateral from May 16 to June 6. TETCO said it will coordinate with downstream operators to facilitate the in-line inspection tool runs to minimize flow restrictions. However, depending on nominated quantities, several delivery meters may be restricted during the maintenance.
See Weekly Natural Gas Storage Report for additional Natural Gas Storage Data.
See Natural Gas Analysis for additional Natural Gas Reports and Articles.
See Short-Term Energy Outlook for additional Natural Gas Prices, Supply, and Demand.
|
|