Natural Gas Weekly Update Text
Released: October 28, 2010 at 2:00 P.M.
Next Release: Thursday, November 4, 2010 |
|
|
|
|
Overview (For the Week Ending Wednesday, October 27, 2010)
|
|
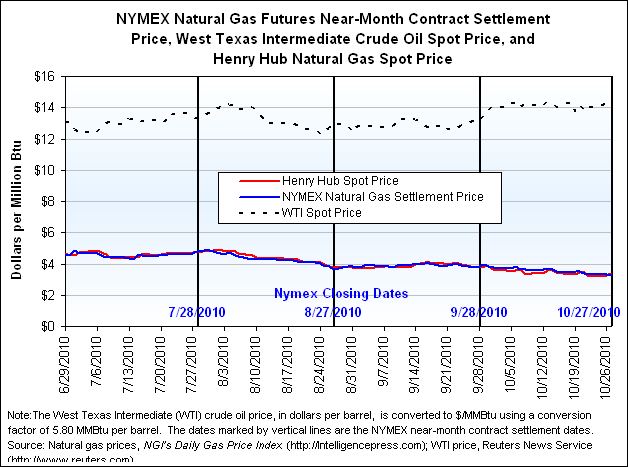
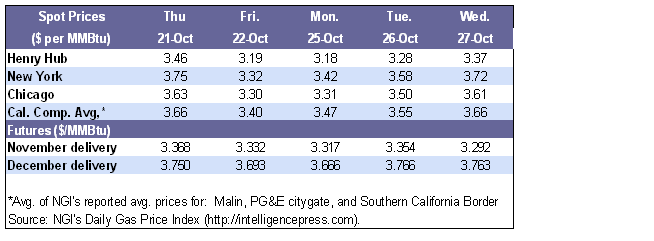
- As the story of abundant natural gas supply continued to provide headlines for the market this report week (Wednesday to Wednesday, October 20–27), spot prices at most market locations in the lower 48 States decreased. Moderate temperatures also likely contributed to the price decline by limiting end-use demand and allowing for the continued replenishment of storage supplies. During the report week, the Henry Hub spot price decreased by 9 cents per million Btu (MMBtu), or 2.6 percent, to $3.37 per MMBtu. Other market prices also decreased between 5 and 20 cents per MMBtu, with a few exceptions.
- The price of the November futures contract at the New York Mercantile Exchange (NYMEX) at final expiration on Wednesday, October 27, was $3.292 per MMBtu. During its tenure as the near-month contract, the November 2010 contract lost about 67 cents per MMBtu in value, reflecting changed expectations of lower prices in the market this winter. The December contract finished the report week at a price of $3.763 per MMBtu, or 13 cents lower than the previous Wednesday.
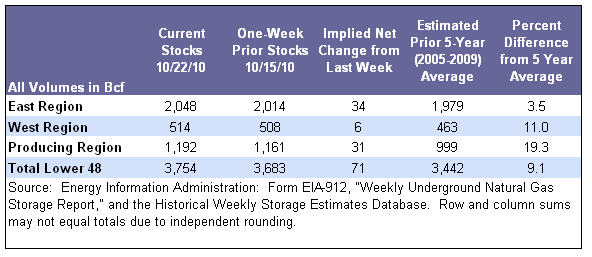
- During the week ending Friday, October 22, estimated net injections of natural gas into underground storage totaled 71 billion cubic feet (Bcf). Working natural gas in underground storage was 3,754 Bcf, which is 9.1 percent above the 5-year (2005-2009) average.
- The West Texas Intermediate (WTI) crude oil spot price decreased 3 cents per barrel during the report week. The WTI crude oil spot price averaged $81.90 per barrel yesterday (October 27), or $14.12 per MMBtu.
|
|
|
 |
|
More Summary Data
|
|
| Prices |
|
|
This report week provided no exception to this fall’s general trend of falling prices amid moderate weather, high storage levels, and a lack of tropical storm activity. However, decreases during the report week were generally less than 20 cents per MMBtu, or less than about 5 percent, as price increases late in the report week nearly removed a steep price decline that occurred before last weekend. At the Henry Hub, the daily average spot price reached a low point of $3.18 per MMBtu on Monday, October 25, before gaining in the next two trading sessions to close the report week at $3.37, down 9 cents for the week. The average of $3.18 per MMBtu was the lowest recorded price at the Henry Hub since November 20, 2009. Other trading locations in the producing region along the Gulf Coast in Louisiana and East Texas generally recorded decreases of about 10 cents per MMBtu, or about 3 percent for the week. The Rockies and Midcontinent producing zones saw price declines of about a dime or slightly more. Nonetheless, there were scattered exceptions of slight upticks in prices, most notably an increase of 59 cents per MMBtu in Florida, in response to lingering warm weather (which increased demand for natural gas as fuel for electric generation). As warm weather moved into Florida this week, Florida Gas Transmission Company LLC issued stricter requirements for balancing takes and nominations because of low linepack on the pipeline.
Aggregate supply and demand fundamentals were nearly unchanged from the previous week, consistent with the small price changes. With the hottest temperatures of the year clearly past and the winter heating season (November through March) not yet started, consumption was limited to an average of about 56 Bcf per day, according to estimates by BENTEK Energy, LLC, which tracks flows on the interstate pipeline grid for indications of changes in supply and demand. Total gas consumption estimates were less than 1 percent higher than the previous week. In the electric power sector, consumption increased 5.2 percent compared with the previous week, offsetting a 2-percent decline in residential and commercial consumption. However, residential and commercial consumption, which is largely heat related, increased approximately 2.2 Bcf per day in the last couple of days of the report week, as cooler temperatures entered the northern parts of the country, providing a glimpse of what is to come. During the week, U.S. production was unchanged from the previous week, averaging over 62 Bcf per day, according to BENTEK.
Some of the largest price decreases during the report week occurred in Northeast markets, where prices reached their lowest levels in 2010. Market prices posted decreases of as much as 5 percent on the week. For delivery in Zone 6 into New York off Transcontinental Gas Pipeline (Transco), the price at the end of the report week averaged $3.72 per MMBtu, a decrease of 5 cents, or about 1.3 percent. Trading at the Intercontinental Exchange, Inc. (ICE), continues to suggest that a much lower price spread between the Northeast and the Henry Hub is developing. The price for deliveries to Transco Zone 6 in January 2011, for example, is currently at about $2.20 per MMBtu over the Henry Hub price in ICE trading, while last year at this time the premium was about $3.83. This lower differential is likely because of more supply options for the Northeast, including growing supplies in the Marcellus Shale, access to Rockies supplies, and regasified liquefied natural gas (LNG) from the Canaport LNG terminal in Canada.
|
|
|
|
At the NYMEX, the price of the November 2010 contract decreased in four of the five trading days during the report week. Its price at final expiration (Wednesday, October 27) was $3.292 per MMBtu, which was 25 cents lower than the prior week and the lowest expiration price in 13 months. The November 2010 contract settled about 14 percent lower than the October 2010 contract expiration price of $3.837 per MMBtu and 23 percent lower than the November 2009 contract expiration price of $4.289. The 12-month strip, which is the average price of natural gas futures contracts over the next year, ended trading yesterday at $4.02 per MMBtu, which was $0.12 lower than the price of the strip last week. The current (October 27) price of the December 2010 contract is about $1.52 per MMBtu lower than the price of the December 2009 contract at this time last year.
|
|
|
|
More Price Data
|
|
| Storage |
|
|
Working natural gas in storage increased to 3,754 Bcf as of Friday, October 22, according to Energy Information Administration's Weekly Natural Gas Storage Report (see Storage Figure). The implied net injection for the report week was 71 Bcf, higher than last year’s net injection of 24 Bcf and the 5-year (2005-2009) average injection of 45 Bcf. This marks the seventh week in a row that this year’s injections exceeded last year's.
Significantly higher production this year compared to last combined with mild weather and relatively low heating demand has driven storage rapidly higher over the past month. Total storage is now just 1 Bcf below the level seen in 2009, a record-breaking year. Working gas inventories are 312 Bcf above the 5-year average level. Average U.S. temperatures have exceeded last year’s temperatures for the fifth consecutive week.
Temperatures were once again relatively mild in the lower 48 States during the week ending October 21. Based on the National Weather Service’s degree-day data, temperatures in the lower 48 States were 0.4 degrees warmer than normal and 3.7 degrees warmer than last year at this time, leading to a decline in heating degree days of 7 percent and 28 percent respectively (see Temperature Maps and Data). Heating degree days were lower than normal for each census division except for New England and the Middle Atlantic. Heating degree days were also lower than last year in each division except the Pacific. Temperatures were highest in the West South Central Census Division at 68.0 degrees, 2.3 degrees higher than normal. They were lowest in New England at 48.3 degrees, 1.6 degrees below normal.
|
|
 |
|
More Storage Data |
|
Other Market Trends |
|
USGS Study Lowers Estimates of Oil and Natural Gas Reserves in Alaska Relative to 2002 Estimates. According to a study released October 26, the United States Geological Survey (USGC) estimated that there are 896 million barrels of undiscovered technically recoverable conventional oil resources and 53 trillion cubic feet (Tcf) of conventional undiscovered technically recoverable non-associated gas resources within the National Petroleum Reserve in Alaska (NPRA). The new estimate is only about 10 percent of USGS’s 2002 estimate of 10.6 billion barrels of oil, and about 87 percent of the 2002 natural gas estimate of 61 Tcf. According to the USGS, the unanticipated change in resource estimates is the result of geologic indicators obtained via recent activity in the area that are more indicative of gas than oil, particularly in areas west of the Alpine oil field. The slight decline in natural gas resources, according to the USGS, partially reflects the elimination of four gas-prone plays from the assessment as conventional resources. More information about the USGS’s study is available here: http://www.usgs.gov/newsroom/article.asp?ID=2622&from=rss_home
Efficiency Gains Continue in Interstate Natural Gas Pipeline Transportation. Incremental design and operational improvements over several decades now means the efficiency of natural gas transportation by pipeline is far beyond what it was in the past, according to a new report by the Interstate Natural Gas Association of America (INGAA). The association found efficiency improvements have come in many forms, with changes in the strength of steel perhaps leading to the most significant developments. Available steel yield strength now is more than twice the strength of steel used in construction of the first interstate pipelines, beginning in 1929 with the construction of Natural Gas Pipeline of America by Peoples Gas Light & Coke Company. The increases in strength of steel have allowed companies to increase diameters of pipelines and nearly double operating pressures, according to the report, which is titled “Interstate Natural Gas Pipeline Efficiency.” One major development advancing the efficiency of pipelines came in the 1980s when pipeline companies expanded their use of “pigging” technology, which generally refers to the practice of using pipeline inspection gauges to perform various operations on a pipeline. Additionally, INGAA documents that technology advances have also significantly lowered operation and maintenance costs by allowing companies to operate pipelines remotely through a central gas control center. Over the decades, there have been numerous efficiency gains in the design and operation of compressors, which provide the energy to operate the pipelines. For example, the report notes that since 1995, the efficiency of newer and more sophisticated gas-fired reciprocating engines at compressor stations has increased significantly. This has occurred even as improvements have occurred in emissions control systems to meet increasingly stringent environmental requirements. Despite the advancements in efficiency, INGAA was careful to point out that every pipeline system is different and certain operational decisions are not undertaken for transportation efficiency alone. For example, pipeline companies must balance goals for operating and design efficiency with the need to provide reliable and flexible service to customers, according to INGAA.
|
|
| |
|
Natural Gas Transportation Update |
|
- High natural gas storage inventories in the West continue to have an impact on gas systems in the area. Pacific Gas and Electric (PG&E), for example, issued a customer-specific Stage 2 high inventory Operational Flow Order for Tuesday for its California Gas Transmission System, which was expanded to their entire system through Thursday. Currently, penalties for exceeding a 12-percent tolerance on positive daily imbalances are $1 per decatherm.
- After declaring a System Underrun Limitation (SUL) for all market-area zones on Friday, October 22, through Sunday, October 24, Northern Natural Gas allowed the SUL to expire Monday. Due to an increase in forecasted weighted temperatures for the end of the current week, Northern Natural Gas declared another SUL for all market areas for October 30 and October 31.
- Florida Gas Transmission Company (FGT) notified their customers that due to forecasted high temperatures in the 90s in Florida and low linepack there will be an Overage Alert Day on October 28 for their customers in the FGT Market Area. A tolerance of 25 percent was set.
See Weekly Natural Gas Storage Report for additional Natural Gas Storage Data.
See Natural Gas Analysis for additional Natural Gas Reports and Articles.
See Short-Term Energy Outlook for additional Natural Gas Prices, Supply, and Demand.
|
|