Natural Gas Weekly Update Text
Released: August 12, 2010 at 2:00 P.M.
Next Release: Thursday, August 19, 2010 |
|
|
|
|
Overview (For the Week Ending Wednesday, August 11, 2010)
|
|
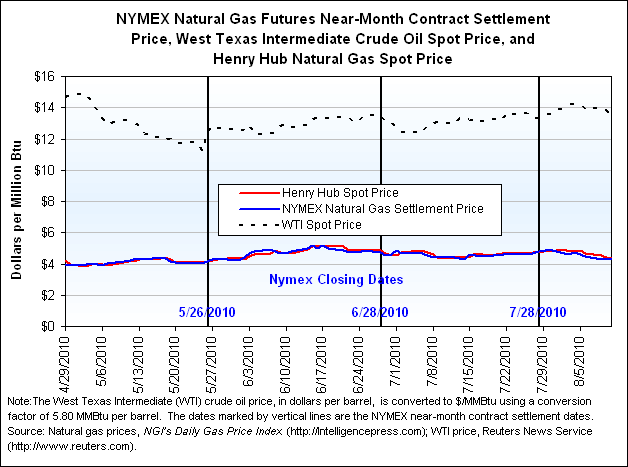
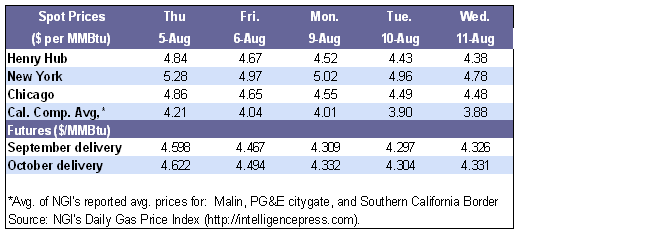
- Summer heat and increased demand this week were insufficient to sustain the natural gas price level, as prices at trading locations across the lower 48 States posted decreases. Overall, spot price at most locations in the lower 48 States fell between 30 and 45 cents per million Btu (MMBtu), although a number of locations posted price decreases of as much as 52 cents per MMBtu. The Henry Hub spot price ended the report week yesterday, August 11, 39 cents lower than the preceding week, at $4.38 per MMBtu.
- At the New York Mercantile Exchange (NYMEX), the futures contract for September delivery at the Henry Hub ended trading yesterday at $4.326 per MMBtu, decreasing by 41 cents, or about 9 percent, during the report week.
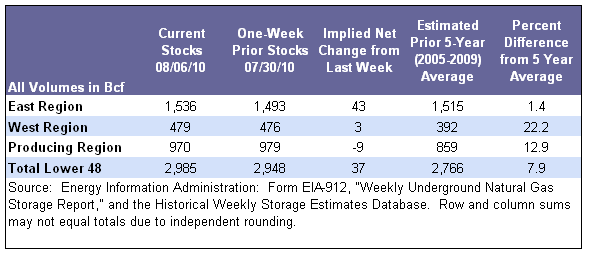
- Natural gas in storage increased to 2,985 billion cubic feet (Bcf) as of August 6, following net injections totaling 37 Bcf. As of the latest report, inventories were 7.9 percent above the 5-year average (2005-2009).
- The spot price for West Texas Intermediate (WTI) crude oil decreased by $4.40 per barrel since Wednesday, August 4, to $78.09 per barrel or $13.46 per MMBtu.
- The number of natural gas rigs drilling totaled 983 for the week ending August 6, according to Baker Hughes Incorporated. The rig count increased by 11 rigs compared with the previous week.
|
|
|
 |
|
More Summary Data
|
|
| Prices |
|
|
Hot temperatures, increased demand, and the latest NOAA forecast of an active hurricane season had a limited effect on prices, as a favorable supply picture likely mitigated any demand-related price effects. Spot prices fell across the lower 48 States, with the majority of the points falling between 30 and 45 cents per MMBtu. Overall, spot prices in the Northeast registered the largest price decreases on the week, with the price at the Transcontinental Zone 6 trading location, which serves markets in and around New York City, falling 52 cents per MMBtu to $4.78. Prices at other locations in the Northeast fell between 36 and 49 cents per MMBtu. Despite the extreme heat, trading locations in the Gulf of Mexico States also posted sizeable decreases. For example, prices at locations serving markets in Mississippi and Alabama fell by an average of 42 cents per MMBtu, while prices in Louisiana decreased by about 40 cents. The Henry Hub spot price fell by 39 cents, or 8 percent, ending trading yesterday at $4.38 per MMBtu.
As has been the case in recent weeks, price swings at the Florida Gas Transmission (FGT) market location were much more pronounced than price changes at the other markets in the lower 48 States, with prices falling 62 percent per MMBtu since last Wednesday. In recent weeks, spot prices at the FGT location have exhibited significant variability relative to other market locations in the lower 48 States, posting a decrease of $8.42 per MMBtu to $5.24 during the latest report week. This latest price swing followed a weekly increase of $5.80 per MMBtu recorded the previous week. Large price swings have become fairly typical at the Florida market location in recent weeks, posting prices in excess of $14 per MMBtu -- a level that has rarely been recorded previously at this location. These unusual pricing patterns at the Florida citygate prompted the Federal Energy Regulatory Commission to announce that it is monitoring price spikes at this location. Factors contributing to the recent price swings likely included hot weather, supply interruptions, and an increase in gas-fired generation, resulting in part from nuclear power plant outages. FGT’s service territory has experienced hot weather, keeping pipelines in the area operating at or near capacity. Since July 8, FGT has issued a series of approximately 30 daily overage alerts on its system. Additionally, intermittent maintenance issues at Gulf South Pipeline’s compressor station in Alabama affected gas flows to Florida. Finally, the 838-megawatt Crystal River nuclear power facility located near Gainesville has been out of service for maintenance, and natural-gas-fired generation is likely meeting some of the demand not met by Crystal River.
Prices west of the Rockies declined at most markets during the week, ending trading yesterday below $4 per MMBtu, while virtually all locations east of the Rockies remained above $4. Natural gas spot prices fell this week at all trading locations serving markets in California, ending trading yesterday below $4 per MMBtu at each of the locations. The Pacific Gas and Electric Citygate location, which serves northern California markets, ended trading yesterday at $3.99 per MMBtu, falling to its lowest price since November 20, 2009. Prices at the remaining locations serving California fell to their lowest level in over a month. Prices at locations in Arizona and Nevada also fell below $4, with the Kern Delivery point in the area ended the trading week at $3.86 per MMBtu.
Natural gas demand saw a sizeable increase this week compared with last week and the same week last year. Total demand for the week ending August 11 rose by 5 percent compared with last week, according to BENTEK Energy, LLC, and was about 13 percent higher than last year. Consumption in the residential and commercial sectors rose by 27 percent this week, while natural gas demand for electric power generation increased by 4 percent overall in the United States. The increase in the use of natural gas for electric power generation was particularly pronounced in the Gulf region.
Natural gas demand exceeded total supply for 3 days this report week, the first time this occurred since mid-March. Total natural gas supply remained fairly flat this week compared with last, although it showed a significant increase compared with the same week last year, according to BENTEK. The increase in this week’s total supply compared with last year was mainly driven by the increase in domestic production (6 percent), which offset the significant declines in Canadian imports (5 percent) and liquefied natural gas sendout (17 percent). Total supply each day this week exceeded 66.6 Bcf per day.
|
|
|
|
At the NYMEX, the price of the near-month contract for September delivery decreased by 41 cents during the report week to $4.326 per MMBtu. On Tuesday, August 10, the price of the near-month contract reached a 10-week low, when it ended the session at $4.297 per MMBtu, the lowest price since June 1, when the July contract ended trading at $4.248 per MMBtu. Prices in the futures market are declining, despite eight consecutive weeks of a shrinking storage surplus compared to the 5-year average. Furthermore, the near-month futures contract gas price has been lower than the spot price, or backwardated since the beginning of August. Backwardation is generally associated with a tight supply-demand balance and can occur during hot summer periods as well as during winter months. During the report week, the Henry Hub traded at an average premium of 15 cents relative to the NYMEX near-month price. The price of the 12-month strip fell by 34 cents or 7 percent to $4.70 per MMBtu.
|
|
|
|
More Price Data
|
|
| Storage |
|
|
Working gas in storage totaled 2,985 Bcf as of Friday, August 6, according to EIA’s Weekly Natural Gas Storage Report (see Storage Figure). The implied net injection during the report week was 37 Bcf, bringing the current level of supplies in underground storage to 7.9 percent above the 5-year average (2005-2009). This week’s net injection fell short of both the 5-year average net injection of 39 Bcf and last year’s net injection of 63 Bcf. Once again, the Producing Region saw a net withdrawal of 9 Bcf.
This week’s net injection of 37 Bcf marks the eighth consecutive week that fell short of the 5-year average net injection, resulting in a decreasing surplus of current inventories over the 5-year average inventories. Furthermore, last week’s net injection was the lowest net injection for August since 2007. However, despite the lower-than-average net injection, total inventories were within 15 Bcf of 3 trillion cubic feet (Tcf), reaching this level earlier than in any previous year with the exception of 2009, when the 3-Tcf threshold was reached in the second half of July.
The lower-than-average net injection this week likely was the result of the increase in space cooling demand, particularly in the southern half of the country. Temperatures in the United States as a whole exceeded normal by an average of 2 degrees for the week ending August 5, marking the 11th consecutive week in which temperatures exceeded normal levels. As measured by National Weather Service cooling degree-days (CDD), temperatures in each of the Census Divisions, with the exception of the New England and Pacific Census Divisions, exceeded normal levels by between 5 and 40 percent. Temperatures in the East South and West South Central Census Divisions, which geographically roughly coincide with the Producing Region, recorded the highest temperatures as well as the largest temperature deviations from normal, with the average weekly temperature exceeding normal levels by 40 and 18 percent, respectively (see Temperature Maps and Data).
|
|
 |
|
More Storage Data |
|
Other Market Trends |
|
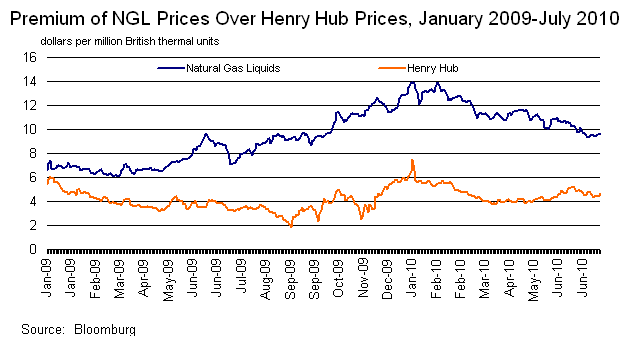
Premium of Natural Gas Liquids over Henry Hub Prices Grows. Since March 2009, the premium for natural gas liquids (NGLs) over the price of natural gas has grown. NGLs, which include propane, ethane, butane, pentane and natural gasoline, are produced in conjunction with natural gas, and the quantity of liquids varies from basin to basin and often from well to well within the same area. In order to take advantage of the NGL price premiums, producers are increasingly seeking out liquid-rich shale plays—such as Eagle Ford in South Texas and the Marcellus in the Northeast. Analysts from Credit Suisse and BENTEK Energy estimate the gas-alone break-even costs for these shale plays range from $3.14 to $3.82 per MMBtu. Depending on the levels of NGLs in a well, NGLs can add more than $3/MMBtu to the value of natural gas production.
There are some logistical considerations because processing NGLs into their component products requires a process called fractionation—70 percent of U.S. fractionation capacity is in the Texas and Louisiana Gulf region. Capacity expansion to process the additional NGLs, as well as additional pipelines that can handle liquids, are currently under construction. Additionally, the market centers for NGL products are not widespread, located only in Texas and California, and new distribution routes and infrastructure for the products are needed. For example, in the Marcellus, the ‘Mariner Project,’ expected to begin service in the second quarter of 2012, will initially ship up to 50,000 barrels of ethane per day via marine vessels to the Gulf Coast premium market.
In recent months the premium of NGLs over natural gas has contracted somewhat from levels of more than $8 per MMBtu in November 2009. In July, the premium was generally in the $4 to $5 per MMBtu range. However, NGL prices still remain well above Henry Hub prices. (See figure)
U.S. Government and Oil Industry Continue Response to Gulf of Mexico Oil Spill. Response continues in the Gulf of Mexico to the aftermath of the April 20 loss of pressure control at BP’s Macondo (MC252) well and the ensuing explosion aboard and the sinking of the Deepwater Horizon mobile drilling unit, which occurred about 50 miles south of Venice, Louisiana. The latest information includes:
|
|
- The administration has continued its oversight of reimbursements to Americans who suffered financial loss as a result of the oil spill. Since the incident occurred 146,267 claims have been filed and more than $329 million has been disbursed in compensation.
- On August 5 the Macondo well’s central pipe was pumped full of cement as the initial step in permanently shutting the well down. Subsquent pressure readings and absence of oil spillage have indicated that this operation was successful.
- Development Driller III has reached a depth of 17,909 ft. below the surface in its effort to drill the first of two relief wells. Drilling of a second relief well was suspended at 15,874 ft., so as not to interfere with the first relief well.
- Tropical Depression 5 was dismantled by wind shear on August 11, allowing resumption of operations to intersect the Macondo well’s annulus with the first relief well so that the Macondo well can be permanently cemented shut from its bottom.
|
More information about the ongoing response is available at http://www.bp.com
National Oceanic and Atmospheric Administration (NOAA) Still Expects Active Atlantic Hurricane Season. NOAA continues to predict an active hurricane season in 2010 across the Atlantic Basin, according to a report released August 5. NOAA’s updated projections have a 70-percent probability to occur within the ranges provided. The updated outlook is milder than the figures that were released in May from NOAA, with a smaller range of storms. Comparisons of the updated NOAA projections are included in the table below:

More information about NOAA forecast of the active hurricane season is available at http://www.noaa.gov/.
EIA Projects Rising Natural Gas Consumption, Prices through 2011. The Energy Information Administration (EIA) released its latest Short-Term Energy Outlook (STEO) on August 10, projecting that the spot price of natural gas at the Henry Hub will increase in 2010. EIA expects that the average annual Henry Hub spot price will average $4.69 per MMBtu in 2010, primarily as a result of increased levels of natural gas consumption. In addition, EIA projects that the Henry Hub spot price average could reach $4.98 per MMBtu in 2011. Total natural gas consumption is projected to increase by 3.8 percent over 2009 levels to 64.9 billion cubic feet per day (Bcf/d) in 2010, owing to increased use of natural gas in both the power generation and industrial sector. Use of natural gas for power generation is expected to grow by more then 1Bcf/d to 20 Bcf/d in 2010. EIA projects that consumption levels in 2011 will remain comparable with those in 2010. EIA expects that total U.S. marketed production will increase to 61.1 Bcf/d in 2010, but will decline by 0.8 Bcf/d in 2011 as relatively low prices depress drilling activity.
|
|
| |
|
Natural Gas Transportation Update |
|
- Florida Gas Transmission Company, LLC (FGT) during the last week first loosened and then ended restrictions on shipper flexibility in scheduling flows that had been in effect continuously since July 8. FGT, which transports peak volumes in the summer as electric generators increase demand to meet air-conditioning needs in Florida, first expanded its tolerance for shippers to take unscheduled volumes from its system from 20 percent to 25 percent for gas flows on Friday, August 6. Finally, the “Overage Alert Day” alert, which essentially requires shippers to balance supply and demand rigorously, was cancelled as temperatures in the State cooled at least temporarily on Saturday, August 7. Nonetheless, FGT reminded shippers this week that highs in the mid 90s are forecasted in Florida for the next several days. As a result, FGT said, customers in FGT’s market area were notified that there is the potential that FGT may issue an Overage Alert Day on one of the upcoming gas days.
- It was an active week for shippers transporting on Tennessee Gas Pipeline Company (TGP) in the Northeast. TGP on August 10 issued a warning to shippers in the Northeast (Zones 5 and 6 on TGP) that they should balance the supplies and takes from the pipeline system. The pipeline company cited low linepack and hot weather in its market area in asserting the need to protect its operational integrity. During the report week, TGP also completed test-running a compressor unit at its Station 325 in Liberty, New Jersey. Following the testing, TGP declared it would be performing further maintenance. The company anticipates the unit returning to service on Friday, August 13. Estimated loss of capacity through this area from the unit failure is 50 million cubic feet (MMcf) per day, according to TGP. Separately, flows at the TGP interconnection with the Rockies Express Pipeline (located at Big Muskie, Ohio) were reduced to zero beginning August 11 due to maintenance. This disruption is anticipated to continue until August 19. Flows for today were scheduled to remain at zero at Big Muskie, displacing approximately 540 MMcf per day, according to BENTEK Energy.
- Natural gas in storage increased to 2,985 billion cubic feet (Bcf) as of August 6, following net injections totaling 37 Bcf. As of the latest report, inventories were 7.9 percent above the 5-year average (2005-2009).
- Gulf South Pipeline Company, LP, on Wednesday, August 11, reported that it has restarted full operations at its compressor station in Mobile County, Alabama. The Airport Compressor Station delivers to both Gulfstream Pipeline and Florida Gas Transmission. The announcement came shortly after the pipeline said it had completed maintenance on a compressor unit station near Clarence, Louisiana. Separately, Gulf South said it will be performing maintenance at its compressor station in Tallulah, Louisiana, from August 21-28. During the first 3 days of the maintenance, deliveries from Gulf Crossing Pipeline to Gulf South will be shut-in and during the last 5 days they will be limited to 885 MMcf per day, the pipeline said.
See Weekly Natural Gas Storage Report for additional Natural Gas Storage Data.
See Natural Gas Analysis for additional Natural Gas Reports and Articles.
See Short-Term Energy Outlook for additional Natural Gas Prices, Supply, and Demand.
|
|
|