Natural Gas Weekly Update Text
Released: June 17, 2010 at 2:00 P.M.
Next Release: Thursday, June 24, 2010 |
|
|
|
|
Overview (For the Week Ending Wednesday, June 16, 2010)
|
|
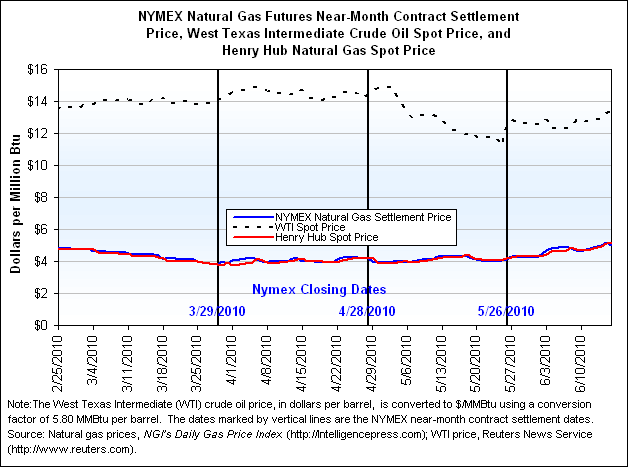
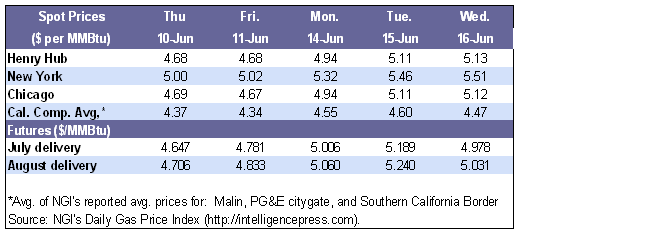
- Natural gas spot prices rose at nearly all market locations in the lower 48 States since last Wednesday, June 9. Increases ranged between $0.01 and $1.03 per million Btu (MMBtu), continuing an upward trend that began in early May. The Henry Hub spot price ended the report week yesterday, June 16, at $5.13 per MMBtu, 8 percent higher than the previous Wednesday.
- At the New York Mercantile Exchange (NYMEX), the futures contract for July delivery at the Henry Hub ended trading yesterday at $4.978 per MMBtu, increasing by 30 cents or about 6 percent during the report week. The July contract fell 21 cents in the last trading day of the report week.
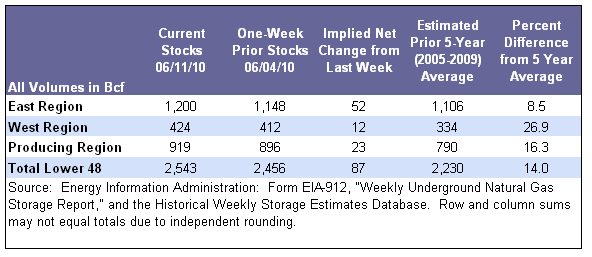
- Natural gas in storage increased to 2,543 billion cubic feet (Bcf) as of June 11, following an 87-Bcf injection. As of last Friday, inventories were 14 percent above the 5-year average (2005-2009).
- The spot price for West Texas Intermediate (WTI) crude oil rose on the week, increasing by $3.29 since Wednesday, June 9, to $77.67 per barrel or $13.39 per MMBtu.
- The number of natural gas rigs drilling totaled 954 for the week ended June 11, according to Baker Hughes Incorporated. The rig count increased by 7 rigs, following a 20-rig decrease the week prior (ended June 4) (see Other Market Trends).
|
|
|
 |
|
More Summary Data
|
|
| Prices |
|
|
Continuing an overall upward trend, natural gas spot prices rose this week, likely in response to the summer-like temperatures across much of the country and increasing crude oil prices. The increase in cooling demand in many areas of the country put upward pressure on spot prices this week. The largest price hikes occurred at trading locations that serve markets in Florida. The Florida Gas Transmission location posted an increase of $1.03 on the week, ending trading yesterday at $8.27 per MMBtu, marking the highest price of any trading location in the lower 48 States. Market locations in the Northeast also registered some sizeable increases, with Dracut, Massachusetts, and several market locations located along the Transcontinental Pipeline increasing between 43 and 57 cents per MMBtu. Overall, prices at market locations in the Northeast averaged $5.42 per MMBtu, rising by an average of 8 percent.
Prices in the Rockies and west of the mountain range also increased on the week; however, the increases were significantly lower than those in the eastern half of the country. Price increases were limited to 3 cents (1 percent) at locations serving California and the Pacific Northwest, despite summer-like temperatures. These relatively small increases in natural gas prices may have been partly the result of limited natural gas demand for electric power generation in the area. For example, the Bonneville Power Administration (BPA), which owns and operates much of the Pacific Northwest hydropower plants, reported that storms occurring in May and thus far in June contributed to high water flow. The surge in rainfall has resulted in an increase in hydropower generation, displacing other fuels in the Pacific Northwest. Some electric power generated in the Pacific Northwest is being exported to California and other States. Prices at market locations in the Rocky Mountains increased by up to 6 cents this week, and remained the lowest prices in the country at an average of $4.23 per MMBtu.
Summer-like temperatures across much of the country, particularly in the East and South, likely led to the 5-percent increase in natural gas demand for electric power generation this report week. However, overall U.S. demand fell by 1 percent this week, despite the week-to-week increase in power burn, according to estimates from BENTEK Energy Services, LLC. Residential and commercial demand fell by 14 percent compared with the previous week, while industrial demand decreased roughly 2 percent.
Total natural gas supply was fairly flat compared with the previous week, increasing by 0.2 percent. Natural gas supply remained stable despite the jump in liquefied natural gas (LNG) imports this week, which rose by more than 11 percent over last week, according to BENTEK estimates. Domestic production remained robust, exceeding 60 Bcf per day in 5 out of the 7 days last report week. However, a 5-percent decrease in Canadian imports offset increases in LNG imports and production, resulting in a weekly net increase of only 0.2 percent.
|
|
|
|
At the NYMEX, the price of the near-month contract for July delivery rose by 30 cents during the report week to $4.978 per MMBtu, increasing in four of the week’s five trading sessions. On Monday, June 14, the price of the July contract traded at $5.006 per MMBtu, the first time a near-month contract has exceeded $5 per MMBtu since February 19, 2010. Prices for the remaining contracts for delivery through the end of the next heating season (through March 2011) also all increased by between 14 and 30 cents per MMBtu, with the contracts for delivery during the summer months registering the largest increases. The 12-month strip increased 16 cents since last week, ending trading yesterday at $5.355 per MMBtu.
|
|
|
|
More Price Data
|
|
| Storage |
|
|
Working gas in storage totaled 2,543 Bcf as of Friday, June 11, according to EIA’s Weekly Natural Gas Storage Report (see Storage Figure). The implied net injection during the report week was 87 Bcf, bringing the current level of supplies in underground storage to 14 percent above the 5-year average (2005-2009). The net injection of 87 Bcf was about 4 percent higher than the 5-year average net injection, but fell short of last year’s net injection by about 23 percent. Six of the seven most recent net injections have been lower than year-ago levels, causing the surplus of current inventories over those of last year to decrease. In fact, current inventories are less than one-tenth of a percent higher than the last year’s level for the comparable week, down from a peak of 6 percent in late April.
Temperatures for the country as a whole were about 30 percent warmer than normal. This week’s above-average injection occurred during a week when temperatures across the country exceeded normal temperatures, averaging 71.3 degrees compared with a normal average of 68.6 degrees. Each Census Division with the exception of East North Central recorded temperatures that were above normal, with deviations ranging between 1 and 7 degrees (see Temperature Maps and Data).
|
|
 |
|
More Storage Data |
|
Other Market Trends |
|
FERC Issues a Notice of Proposed Rulemaking and an Order Granting Clarification. On June 17, the Federal Energy Regulatory Commission (FERC) issued two separate documents that outline new rules for some natural gas companies. In the Notice of Proposed Rulemaking (NOPR), FERC is asking the public to comment on its proposal to revise certain financial reporting forms natural gas companies are required to submit to FERC. The revisions would include functionalized fuel data as well as amount of fuel waived, discounted or reduced as part of a negotiated rate agreement. FERC is seeking comments on this NOPR over the next 60 days. In its Order Granting Clarification, FERC addresses pending requests to clarify Form No. 552, on which natural gas market participants must annually report information regarding physical natural gas transactions that use an index or that contribute to or may contribute to the formation of a gas index. Order No. 704 requires market participants to file these reports to increase transparency concerning the use of indices to price natural gas and how well index prices reflect market forces. Order No. 704 revises Form No. 552, including an exemption from reporting any unexercised options to take gas under a take-or-release contract and clarification of the definition of exempt unprocessed natural gas transactions. The revisions also create an exemption from reporting cash-out and imbalance transactions. This rule will become effective September 30, 2010. More information is available http://www.ferc.gov/legal/maj-ord-reg.asp.
FERC Extends Deadline for Compliance With Orders 720 and 720-A. On May 28, FERC extended the deadline for intrastate natural gas pipeline companies to comply with Order 702 and 702-A from July 1 to September 1, 2010. The Orders require intrastate pipelines which transport more than 50 million MMBtu per year to post operational data for all receipt and delivery points with design capacity of more than 15,000 MMBtu per day. FERC said that additional time will allow pipelines to comply with requirements based on any additional guidance from the Commission. More information is available at www.ferc.gov.
Natural Gas Rig Count Rises by 7; Gulf of Mexico Rig Count Continues to Decline. According to Baker Hughes Incorporated data released on June 11, the natural gas rotary rig count rose by 7 to 954 since the prior week. The rig count has oscillated over the past several weeks, following several months of continuous increases. Possibly reflecting the influence of a recent Federal 6-month moratorium on deepwater drilling, the natural gas rig count in the Gulf of Mexico fell by 2 this week. Currently, only 12 natural gas rigs are active in the Gulf of Mexico, compared with 42 rigs 1 year ago, and 22 at the beginning of 2010. While the moratorium has likely contributed to rig count declines in recent weeks, the rig count in the Gulf of Mexico has shown a long-term decline over the past several years. Increases in the number of horizontal rigs, particularly in shale plays, have helped to compensate for some of the losses in the Gulf of Mexico rig count. During the week, horizontal rigs (including both oil and natural gas) rose by 21 to a total of 819, the highest level for the more than 19 years for which data are available.
Government and Industry Continue to Respond to Leaking Oil in the Gulf of Mexico. Response continues to the oil leak following the April 20 explosion aboard the Deepwater Horizon mobile offshore drilling unit. The rig was located about 50 miles southeast of Venice, Louisiana. Some of the latest facts (according to status reports from the Administration-wide response, unless where otherwise noted) include:
|
|
|
|
| |
|
Natural Gas Transportation Update |
|
- El Paso Natural Gas Company on June 14 reported that it had found an anomaly on its Line 1203 in the area of Phoenix, Arizona. As a result, the pipeline company will operate Line 1203 at a lower-than-normal pressure. The lower operating pressure will reduce the pipeline segment’s capacity to 60 million cubic feet (MMcf) per day from a normal capacity of 100 MMcf per day beginning June 15. El Paso will install a by-pass on Line 1203 on June 22, 2010, which will reduce capacity to zero for 1 day. In a separate notice to shippers yesterday, June 15, El Paso said it is operating its Line 1102 north of Amarillo, Texas under pressure restrictions. As a result, transportation services will be reduced. Maintenance of this portion of Line 1102 is projected to continue until the end of August 2010.
- Panhandle Eastern Pipe Line Company, LP (PEPL) on June 16 declared a force majeure at its compressor station in Houstonia, Missouri. Although PEPL has been performing maintenance at this compressor station since April 1, 2010, recent increases in flows now require the pipeline to prioritize transportation requests. PEPL anticipates maintenance will continue through the summer.
- Southern Natural Gas Company on June 14 reported finding an anomaly on its 24-inch diameter South Main Loop near its compressor station in Gwinville, Mississippi. The pipeline company has isolated the affected section of pipeline and taken it out of service. Southern Natural intends to prepare a plan for repair and maintenance. While maintenance of the segment is ongoing, Southern said it would implement a capacity allocation if necessary.
See Weekly Natural Gas Storage Report for additional Natural Gas Storage Data.
See Natural Gas Analysis for additional Natural Gas Reports and Articles.
See Short-Term Energy Outlook for additional Natural Gas Prices, Supply, and Demand.
|
|