Natural Gas Weekly Update Text
Released: March 18, 2010 at 2:00 P.M.
Next Release: Thursday, March 25, 2010 |
|
|
|
|
Overview (For the Week Ending Wednesday, March 17, 2010)
|
|
- Natural gas prices continued declining at market locations across the lower 48 States this week, with spot and futures prices registering sizeable losses for the week ended March 17. Spot prices in the lower 48 States fell between 1 and 6 percent on the week, as weather-related demand for natural gas decreased and supplies remained relatively strong.
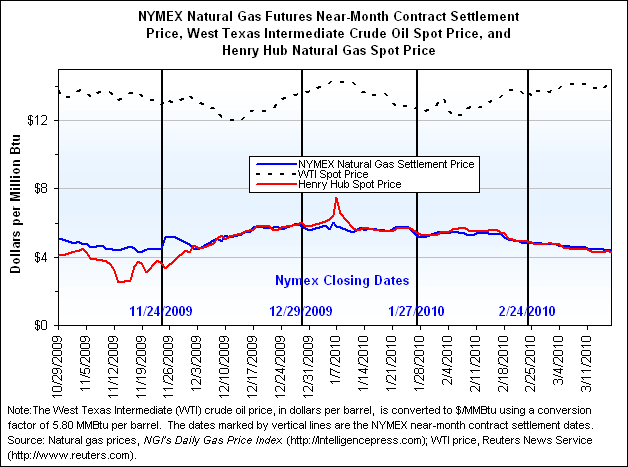
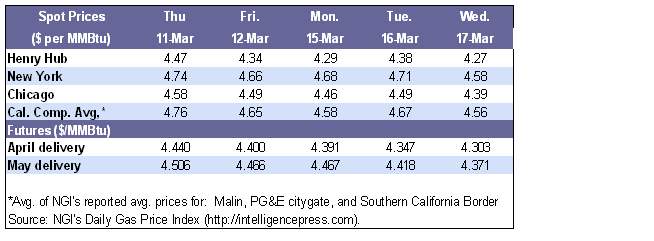
- The Henry Hub spot price ended the report week yesterday 17 cents lower than the preceding week, at $4.27 per million Btu (MMBtu). Since February 17, the Henry Hub spot price has registered a decrease of $1.20 per MMBtu.
- At the New York Mercantile Exchange (NYMEX), the futures contract for April delivery at the Henry Hub ended trading yesterday at $4.303 per MMBtu, falling by 26 cents or about 6 percent during the report week.
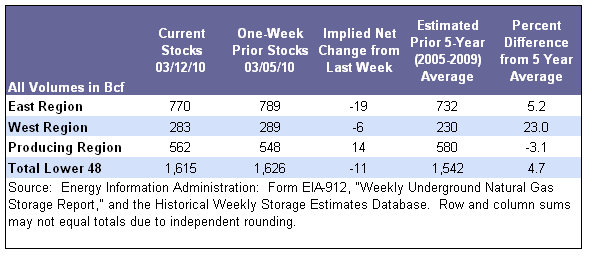
- Natural gas in storage decreased to 1,615 billion cubic feet (Bcf) as of March 12, leaving inventories 4.7 percent above the 5-year average (2005-2009). The implied net withdrawal was 11 Bcf.
- The spot price for West Texas Intermediate (WTI) crude oil increased by 86 cents per barrel since Wednesday, March 10, to $82.93 per barrel or $14.30 per MMBtu. Since February 17, the price of crude oil has jumped $5.66 per barrel or 7.3 percent.
|
|
|
 |
|
More Summary Data
|
|
| Prices |
|
|
Natural gas spot prices continued declining this week, reflecting moderating demand as temperatures warmed in key high-demand areas of the country. Spot prices at market locations across lower 48 States fell since last Wednesday, March 10, with decreases ranging between 4 and 26 cents. Prices at trading locations serving demand centers in the Northeast also fell significantly on the week, as spring-like temperatures arrived. The spot price at the Algonquin Citygate, which delivers natural gas to markets in New England, fell 19 cents or about 4 percent on the week. Transcontinental Pipeline’s delivery into New York City was priced at $4.58 per MMBtu yesterday, 18 cents, or 3.8 percent, lower than the previous Wednesday.
Prices at trading locations serving markets in California registered some of the biggest declines since last Wednesday, particularly the southern portion of the State where temperatures continued to moderate. Natural gas spot price at the Southern California Gas Company’s market location fell 22 cents or about 5 percent since last Wednesday, ending trading yesterday at $4.49 per MMBtu. Prices at the Pacific Gas and Electric trading location, which serves markets in northern California also decreased significantly on the week, falling by 21 cents. However, despite the significant price decline, this location was the highest-priced in the lower 48 States as of yesterday, ending trading at $4.81 per MMBtu. The high price at this location and its spread compared with the Henry Hub and trading locations in the Northeast is the result of several factors. These factors include BENTEK Energy estimates, which show that since the middle of 2009, electric generators in the Western United States have been using more natural gas compared with the 5-year (2005-2009) average. The increased power burn is likely the result of a reduction in hydroelectric power generation in the Pacific Northwest and California because of lower precipitation and drought conditions. Furthermore, natural gas is replacing the 1,100 megawatts of electric power that Unit 2 of the San Onofre Nuclear Generating Station (SONGS) previously generated. SONGS Unit 2 has been out of service since September 2009 for steam generator replacement.
While temperatures in the Rocky Mountain States increased slightly during the report week, they continued to hover in the 30s and 40s. Still, the price of natural gas fell substantially in a few market locations in the Rockies. The highest net weekly price drop occurred at Northwest Pipeline’s Sumas location, which fell by 26 cents or 5.7 percent per MMBtu since last Wednesday. The Sumas premium over Henry Hub decreased from 14 cents to 5 cents per MMBtu as of yesterday. Additionally, prices at Kingsgate in Idaho and Stanfield (for delivery into Oregon) fell by 23 and 22 cents per MMBtu, respectively. Overall, trading locations in the Rockies registered net weekly decreases between 4 and 26 cents per MMBtu.
The across-the-board price decreases likely resulted from the significant reduction in total U.S. demand. Total demand for the week ended March 17 fell by 8.6 percent compared with last week, according to BENTEK Energy. Consumption in the residential and commercial sectors fell by 12 percent, contributing to the week-to-week decline. The majority of the decrease in this sector occurred between Monday and Wednesday of this week, as temperatures rose in areas east of the Rockies. The electric power and industrial sectors also recorded demand decreases of 8.6 and 2.3 percent, respectively.
Natural gas supply exceeded total demand for 3 days this report week, the first time the estimated supply/demand balance was positive since November 26, 2009. However, total natural gas supply fell this week, a result of the decrease in Canadian and liquefied natural gas (LNG) sendout, according to BENTEK. Canadian imports decreased by almost 2 percent compared with last week, while LNG sendout fell by nearly 9 percent over the same period. U.S. natural gas production was flat compared with last week, with volumes totaling only 0.1 percent lower. Total supply of natural gas this week was 0.4 percent lower than last week and 2.2 percent lower than last year for the same week.
|
|
|
|
At the NYMEX, the price of the near-month contract for April delivery decreased by 26 cents during the report week to $4.303 per MMBtu. The price of the April futures contract has decreased fairly consistently since becoming the near-month contract on February 25, falling 46 cents during the period. Remaining contracts for delivery through the end (October 31, 2010) of the upcoming injection season posted similar decreases, ranging between 4.7 and 5.5 percent. Prices on the futures market likely reflect the arrival of spring-like temperatures and continued strength in natural gas production. With only about 2 weeks left in the traditional heating season, which will officially end on March 31, supplies of natural gas are relatively ample. Robust domestic production coupled with the possibility that natural gas inventories in underground storage may close the heating season at about last year’s level could provide considerable downward pressure on prices. Inventories of natural gas in underground storage ended the 2008-2009 heating season at 1,656 Bcf, the highest level since the 2005-2006 heating season ended with 1,692 Bcf of natural gas in storage. The 12-month strip traded yesterday at $4.919 per MMBtu, 22 cents or 4.3 percent lower than last Wednesday.
|
|
|
|
More Price Data
|
|
| Storage |
|
|
Working gas in storage decreased to 1,615 Bcf as of Friday, March 12, according to EIA’s Weekly Natural Gas Storage Report (see Storage Figure). The implied net withdrawal was 11 Bcf, significantly below both the 5-year (2005-2009) average withdrawal of 65 Bcf, and last year’s net withdrawal of 42 Bcf for the report week. The East and West regions both noted net withdrawals for the week; however, storage operators in the Producing region reported the first regional net injection of the season of 14 Bcf. This net injection in the Producing region reduced the storage deficit compared with last year to 135 Bcf, down from 145 Bcf last week. With less than 3 weeks left in the current heating season (November 1-March 31), natural gas stocks in underground storage are on pace to finish the heating season above the 5-year average. If the remaining withdrawals equal the 5-year average withdrawals and injections for the remainder of the month, natural gas stocks would end the heating season at 1,557 Bcf, about 73 Bcf above the 5-year average.
Temperatures in the country were generally warmer than normal for the week ended March 11, with total heating degree-days falling short of normal levels by about 10 percent. Based on the National Weather Service’s degree-day data, temperatures in the United States were 2 degrees warmer than normal, but 3 degrees colder than last year. Four Census Divisions in the Northeast and the Midwest recorded average temperatures that were more than 5 degrees warmer than normal (see Temperature Maps and Data). The West South Central Census Division, which roughly coincides with EIA’s Producing Region, also experienced above-normal temperatures. Despite relatively warmer temperatures in the Northeast and the Midwest, these areas remained cold and registered the lowest temperatures in the country for the week ended March 11. Elsewhere in the United States, average temperatures ranged between 39 and 67 degrees.
|
|
 |
|
More Storage Data |
|
Other Market Trends |
|
EIA Highlights Differences between Projections and Actual Values in AEO. On March 16, EIA released its Annual Energy Outlook (AEO) Retrospective Review, which presents a comparison between projected data for all fuel types in the AEO reference case and the actual outcomes from 1982 to 2009. The report measured the average absolute percent difference, which is the simple mean of the absolute values of the percentage difference between the reference case projection and the actual value. The report concluded that consumption forecasts for most fuel types were often far more accurate than price forecasts, as consumption is relatively more stable compared with energy prices. However, the fuel with the largest difference between projections and actual consumption was natural gas, the result of difficulty in forecasting the effects of regulatory changes in the 1980s. Regarding other natural gas data, EIA’s forecasts were generally 57.6 percent off for wellhead prices; 7.1 percent for consumption; 6.2 percent for production; and 15.6 percent for net imports when the time frame between 1982 and 2009 is analyzed. EIA noted that expectations of technological improvement within the natural gas industry embedded in early editions of the AEO were somewhat conservative, further affecting the accuracy of forecasts. Additionally, despite the large difference between projected and actual wellhead prices from 1982-2009, the error has decreased over time. For example, the AEO had an absolute relative error for natural gas wellhead prices of 7.5 percent in 2006, no error in 2007, and 0.2 percent in 2008. In general, longer-term price forecasts were more inaccurate.
Shale Will Play a Greater Role in Natural Gas Production. Speaking on March 12 to Clean Skies News at the Cambridge Energy Research Associates energy conference (CERAWeek) in Houston, Texas, EIA Administrator Richard Newell discussed increasing prospects for natural gas production from shale formations, as well as the role of natural gas in power generation. Newell noted that shale gas production comprises an increasing percentage share of dry natural gas production, totaling 11 percent in 2009. Over the next 25 years, shale is expected to account for more than 25 percent of dry natural gas production. Newell noted that the electric power sector will contribute substantially to growth in natural gas consumption. Newell also discussed the role renewable energy sources will play in reducing greenhouse gas emissions. A video of Newell speaking is available here: http://www.eia.doe.gov/neic/press/video/video.html
|
|
|
|
|
|
| |
|
Natural Gas Transportation Update |
|
- Southeast Supply Header, LLC (SESH) has begun planned maintenance on several compressor units, reducing available capacity through associated stations on its system. On March 15, work began at the Lucedale Compressor Station in Mississippi. SESH’s capacity through the Lucedale station during maintenance will likely be approximately 870,000 decatherms (Dth) per day, compared with normal capacity of about 1,060,000 Dth per day. From March 18–20, maintenance will occur at the Gwinville Compressor Station, also in Mississippi, where capacity will be limited to 920,000 Dth per day. Lastly, maintenance at the Delhi Compressor Station in Louisiana between March 22 and 27 will limit capacity through the Delhi and Gwinville compressor stations to 800,000 Dth per day. Normal operating capacity through the Delhi and Gwinville stations is 1,020,000 and 1,060,000 Dth per day, respectively.
- Gulf South Pipeline Company LP began maintenance on Unit #3 at Marksville Compressor Station in Louisiana on Tuesday, March 16. According to the pipeline company, work is expected to last 30 days, likely reducing capacity through the station by 150,000 Dth per day. The pipeline company moved up the maintenance from an original start day of March 29.
- Rockies Express Pipeline LLC (REX) on Monday, March 15, informed shippers that it had completed repairs at its compressor station in Cheyenne, Wyoming, returning capacity to 1,900,000 Dth per day. The capacity of REX’s segment 200 in Wyoming had been reduced to 1,550,000 Dth per day on March 7 because of repairs on a transformer at the compressor station.
- Columbia Gas Transmission, LLC on March 16 began planned maintenance on its pipeline in Green County, Pennsylvania. The maintenance will reduce capacity at an interconnect between Columbia and Texas Eastern Transmission near Waynesburg, Pennsylvania. According to BENTEK Energy, flows for March 18 are 80 million cubic feet (MMcf), down 60 MMcf from the 30-day average of 140 MMcf. Maintenance is scheduled to run through April 14, but minimal impact is expected because of below-normal demand in the Northeast, BENTEK said.
See Weekly Natural Gas Storage Report for additional Natural Gas Storage Data.
See Natural Gas Analysis for additional Natural Gas Reports and Articles.
See Short-Term Energy Outlook for additional Natural Gas Prices, Supply, and Demand.
|
|