Natural Gas Weekly Update Text
Released: February 18, 2010 at 2:00 P.M.
Next Release: Thursday, February 25, 2010 |
|
|
|
|
Overview (For the Week Ending Wednesday, February 17, 2010)
|
|
- Natural gas prices continued their decline across much of the country for the week ended February 17. Even prices in the Northeast, which registered large increases during the previous week, fell as of yesterday. On the week, natural gas spot prices registered net decreases at almost all locations in the lower 48 States.
- The significant price increases for the week ended February 10 in the Northeast occurred in response to the two major snow storms that slammed the Mid-Atlantic and parts of the Northeast. However, with average temperatures this report week resembling historical normals, prices in the Northeast slid to pre-snow storm levels.
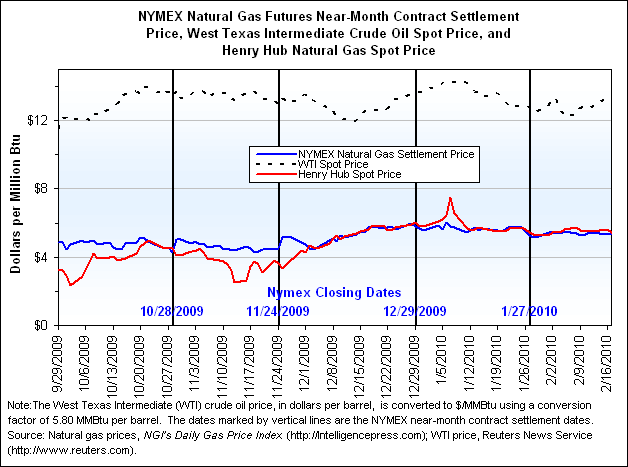
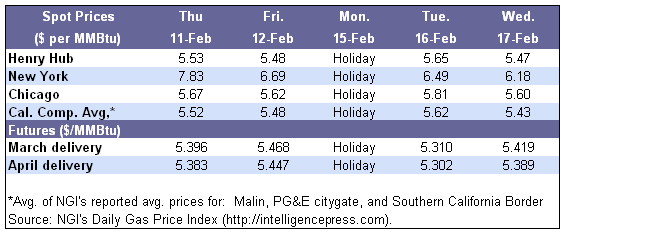
- The Henry Hub spot price ended the report week yesterday 1 cent lower, at $5.47 per million Btu (MMBtu). This slight decrease followed a 3-cent slide the week prior.
- At the New York Mercantile Exchange (NYMEX), the futures contract for March delivery at the Henry Hub ended trading yesterday at $5.386 per MMBtu, rising by 9 cents or about 2 percent during the report week. The increase in the price of futures contract this week followed a 2-percent decrease the week prior.
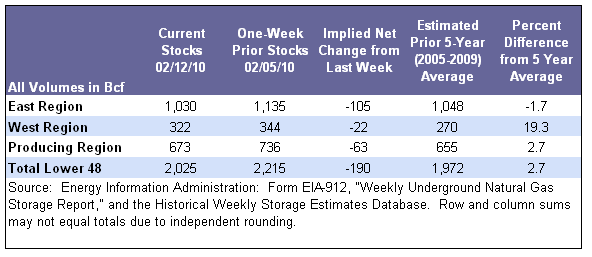
- Natural gas in storage decreased to 2,025 billion cubic feet (Bcf) as of February 12, leaving inventories 2.7 percent above the 5-year average (2005-2009). The implied net withdrawal was 190 Bcf.
- The spot price for West Texas Intermediate (WTI) crude oil increased by $2.79 per barrel since Wednesday, February 10, to $77.27 per barrel or $13.32 per MMBtu.
|
|
|
 |
|
More Summary Data
|
|
| Prices |
|
|
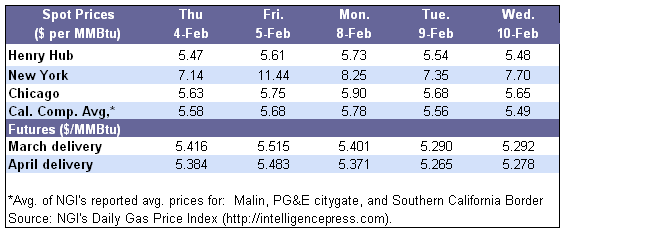
Two major snow storms occurred between February 5 and 10, resulting in significant price increases in the Northeast. On Friday, February 5, the price of natural gas at Transcontinental Pipeline’s Zone 6 location, which serves New York City, jumped to $11.53 per MMBtu, rising by $4.37 compared with the day before. However, following this dramatic jump, prices decreased gradually, ending trading yesterday at $6.18 per MMBtu. Prices also increased in the Midwest and Southeast as a result of colder-than-normal weather for the week ended Wednesday, February 10. The associated increase in space-heating demand pushed up prices in the Northeast for the week ended February 10 by between 3 and 99 cents per MMBtu, while increases at other spot locations were mostly limited to 9 cents. However, there were a number of locations which registered price decreases that week, primarily in California, the Rockies, and Texas.
During the latest report week, which ended yesterday, February 17, spot prices fell at almost all market locations, with the largest drops occurring in the Northeast. In fact, the previous week’s gains were reversed as of yesterday in this region, with prices falling below the pre-storm level. Still, locations serving markets in the Northeast are among the highest-priced, second only to the spot prices in Florida as of yesterday.
An increase in liquefied natural gas (LNG) sendout, as well as an increase in Canadian imports for this time of year, contributed significant supply during the high-demand period this report week. According to Bentek Energy, total LNG sendout from import facilities peaked at 2 Bcf per day for the week on February 11, while Canadian imports peaked at 8.7 Bcf per day on February 10. LNG sendout and Canadian imports totaled 11.3 Bcf and 57.9 Bcf, respectively for the week ended February 17. LNG imports were more than double the level recorded for the same week last year, while Canadian imports exceeded last year’s level for the week by 10 percent. The majority of Canadian imports were destined for the Midwest, accounting for about 37 percent of the total import volume for the week. However, 31 percent of total Canadian imports went to Northeastern markets. According to Bentek, LNG flows into New England have also contributed to a decline in flows into the Ohio Valley from the Gulf of Mexico.
Meanwhile, electric power generators in the Southeastern United States are using above-average volumes of natural gas to cope with record-low temperatures. Throughout the report week, Southeast and Gulf power burn has consistently remained above the 5-year maximum, with the Southeast peaking on Thursday, February 11, at above 5.6 Bcf per day, according to Bentek Energy, reaching the highest level since the beginning of this year. Compared with the same week last year, total natural gas consumed for electric power generation rose 21 percent. Total U.S. demand for the week rose 2.3 percent compared with the previous week, and rose 24 percent compared to the same week last year.
|
|
|
|
At the NYMEX, the price of the near-month contract (for March delivery) increased by 9 cents during the report week to $5.386 per MMBtu. The slight increase in the price of the near-month contract as well as all of the contracts through November 2010 was likely the result of the lingering cold and increasing crude oil prices. For example, the current supply of natural gas appears robust and likely will remain above the 5-year average production level for the remainder of this year.
The April 2010 futures contract also rose by 9 cents or 2 percent since last Wednesday, ending the trading week at $5.363 per MMBtu. At the end of the trading yesterday, the 12-month strip, which is the average price for all natural gas futures contracts over the next year, traded at $5.80 per MMBtu, which was 4 cents or 1 percent higher than its price on Wednesday, February 10.
|
|
|
|
More Price Data
|
|
| Storage |
|
|
Working gas in storage decreased to 2,025 Bcf as of Friday, February 12, according to EIA’s Weekly Natural Gas Storage Report (see Storage Figure). The implied net withdrawal was 190 Bcf, compared with the 5-year (2005-2009) average withdrawal of 178 Bcf, and last year’s net withdrawal of 129 Bcf for the report week. Net withdrawals from working gas in storage exceed historical levels in each of the storage regions. Frigid temperatures likely contributed to the above-normal rate of withdrawals during the report week. Working gas inventories are 26 Bcf higher than year-ago levels and 53 Bcf above the 5-year average level. Working gas in storage continues to exceed year-ago levels for this time of year in East and West storage regions, while stocks in the Producing region are 62 Bcf below last year’s level at this time. Since November 30, cumulative withdrawals from storage totaled 1,808 Bcf, or 23 percent greater than the 5-year average of 1,471 Bcf over the same period.
Temperatures were generally colder than normal in each of the Census Divisions in the lower 48 States during the week ended February 11. Based on the National Weather Service’s degree-day data, temperatures in the lower 48 States during the week ending February 11 were, on average, about 3 degrees colder than normal and 9 degrees colder than last year’s levels (see Temperature Maps and Data). Temperatures were warmest in the Pacific and West South Central Census Divisions, where temperatures averaged 48 and 42 degrees, respectively. Elsewhere in the lower 48 States, average temperatures ranged between 21 and 35 degrees.
|
|
 |
|
More Storage Data |
|
Other Market Trends |
|
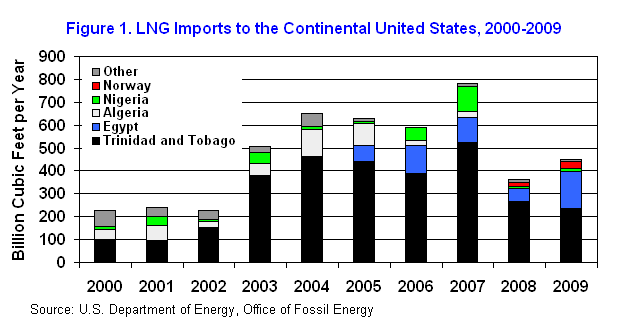
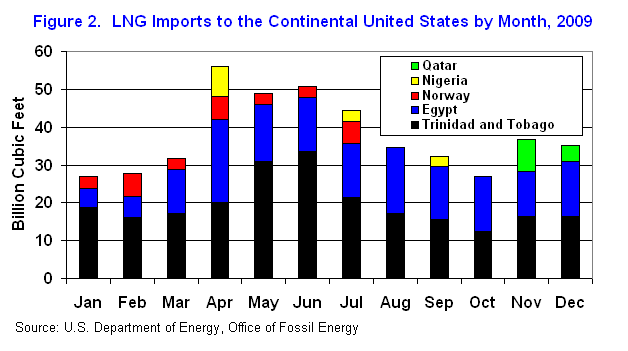
LNG Imports to Continental United States Increased in 2009. Imports of LNG to the continental United States rose 29 percent or 100 Bcf in 2009 to a total of 452 Bcf, according to the U.S. Department of Energy’s Office of Fossil Energy. Five countries supplied U.S. LNG imports during the year: Egypt, Trinidad and Tobago, Nigeria, Norway, and Qatar. (See Figure 1, LNG Imports to the Continental United States, 2000-2009). Volumes from Egypt nearly tripled to 160 Bcf since 2008. Although imports from Trinidad and Tobago decreased by 11 percent to 236 Bcf, the country remained the largest exporter to the United States. Despite the overall increase in LNG imports compared with 2008, total volumes in 2009 were still well below the record of 771 Bcf in 2007. In fact, the total of 452 Bcf in 2009 was the second-lowest annual total since 2002. In the last couple years, higher prices for natural gas in other countries have diverted volumes away from the U.S. market, particularly during high-demand periods in winter months and the months leading up to the winter. (See Figure 2, LNG Imports to the Continental United States by Month, 2009). Distrigas’ regasification facility in Everett, Massachusetts, received the greatest volume of LNG deliveries of any of the 10 import facilities operating during the year. Distrigas received 156 Bcf, primarily from Trinidad and Tobago. El Paso Corporation’s terminal on Elba Island, Georgia, received 142 Bcf - the second-highest volume received by the terminals.
|
|
STEO Forecasts Decrease in Natural Gas Use for Power Generation. On February 10, EIA released the latest update to its Short-Term Energy Outlook (STEO), which includes estimates through December 2011. EIA expects total natural gas consumption to increase by 0.4 percent to 62.5 Bcf per day in 2010, and another 0.4 percent in 2011. However, natural gas use for electric power generation is expected to decline from an estimated 18.8 Bcf per day in 2009 to 18.5 Bcf per day in 2010. The share of natural gas use for power generation is expected fall as a result of more coal-fired generation coming online. The STEO predicts consumption increases in the residential, commercial, and industrial sectors will offset the drop in natural gas for power generation in 2010. As a result of economic recovery, industrial consumption is expected to rebound over the next 2 years, increasing by 0.4 Bcf per day in 2010 and another 0.4 Bcf per day in 2011. The Henry Hub spot price, according to the STEO, is expected to average $5.37 per MMBtu in 2010, an increase of about 36 percent from the 2009 level of $3.95 per MMBtu. The STEO estimates that marketed natural gas production will decline by 2.6 percent in 2010 to 58.7 Bcf per day, partly because of a decline in drilling activity. LNG imports are expected to increase by about 38 percent to 1.8 Bcf per day in 2010 as a result of additions to worldwide LNG supply.
|
|
|
|
| |
|
Natural Gas Transportation Update |
|
- As extreme weather conditions in market areas gradually faded, associated high demand for transportation services fell. Thus, pipeline companies this report week notified customers of increased flexibility for imbalances on their systems. Tennessee Gas Pipeline Company on Friday, February 12, lifted its warning of increased penalties for imbalances for market areas in the Northeast. However, noting emergency maintenance at its Station 321, located in Susquehanna County, Pennsylvania, the company said it does not have the ability to absorb imbalances in the area. Also in the Northeast, Dominion Transmission, Inc. on February 18, rescinded its operational flow order (OFO) requiring shippers to match transported quantities with nominations. In the Southeast, Southern Natural Gas Company on February 17 canceled its OFO for short imbalances.
- Colorado Interstate Gas Company on February 12 notified shippers that withdrawal service will likely remain unavailable until Saturday, February 20. Although repairs to its dehydration facility are complete, commissioning the new equipment is ongoing. Injection capacity is not affected, according to the pipeline company. The company said it will restore withdrawal service as soon as possible and will provide an update no later than Thursday, February 18.
- Columbia Gas Transmission Corporation said Thursday, February 18, will be a Critical Day for storage, with associated limitations in storage services for certain customers. The company expects interruptible storage services to be unavailable, based on withdrawal capacity and forecasted firm withdrawal requirements.
See Weekly Natural Gas Storage Report for additional Natural Gas Storage Data.
See Natural Gas Analysis for additional Natural Gas Reports and Articles.
See Short-Term Energy Outlook for additional Natural Gas Prices, Supply, and Demand.
|
|