Natural Gas Weekly Update Text
Released: December 18, 2008
Next Release: January 8, 2009 |
|
|
|
|
Overview (Wednesday, December 10, to Wednesday, December 17, 2008)
|
|
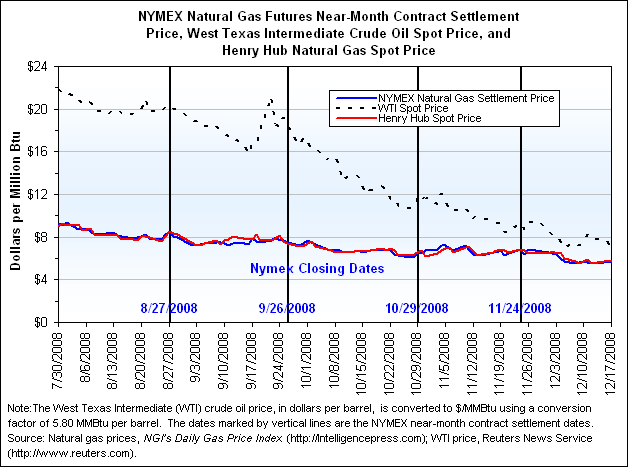
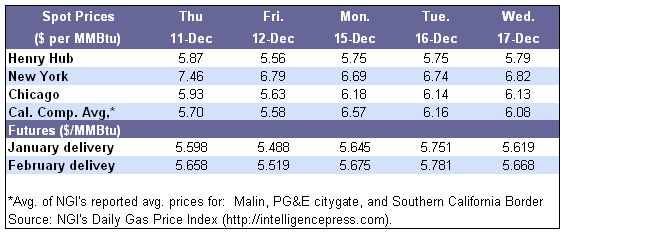
- The coldest temperatures of the season to date covered much of the northern half of the country this report week, boosting demand related to space heating on both coasts and across the Northern Plains and Midwest population centers. Prices increased throughout the country outside the Northeast, with the biggest increases occurring for supplies from the Rocky Mountains (particularly for delivery into the Northwest). During the report week, the Henry Hub spot price increased $0.11 per million Btu (MMBtu) to $5.79.
- At the New York Mercantile Exchange (NYMEX), futures prices decreased slightly for the report week as the current economic downturn continued. Expected to accompany this downturn is a likely large-scale reduction in demand for all energy products, which is affecting pricing for energy in forward markets. The futures contract for January 2009 delivery decreased by 6.7 cents per MMBtu on the week to $5.619.
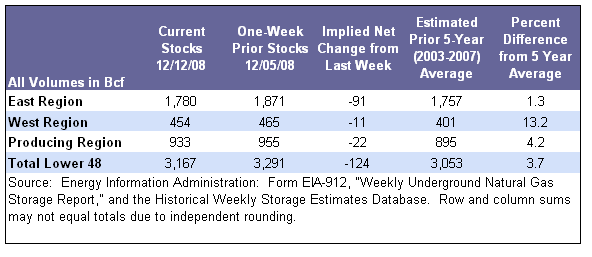
- As of Friday, December 12, working gas in underground storage was 3,167 billion cubic feet (Bcf), which is 3.7 percent above the 5-year (2003-2007) average.
- The price of West Texas Intermediate (WTI) crude oil decreased on the week by $2.93 per barrel to $40.17, or $6.93 per MMBtu. This is the lowest price for WTI crude oil since July 2004.
|
|
|
|
|
More Summary Data
|
|
| Prices
|
|
|
A major weather front entered the Pacific Northwest, Northern Plains, and Midwest, then moved eastward during the report week, bringing the coldest temperatures of the season to date to much of the Lower 48 States. Increased space-heating demand in consuming regions led to gains in spot-market prices in regions outside the Northeast with prices in the Midcontinent and Rockies producing regions generally increasing by between 15 and 25 percent. Prices for supplies from the Gulf of Mexico region generally advanced less than 5 percent. Along the Gulf Coast in Louisiana and in East Texas, the average increase was $0.08 and $0.23 per MMBtu, respectively, resulting in average regional prices of $5.74 and $5.56. The gains appeared mostly related to short-term weather dynamics, rather than a change in the outlook for longer-term market conditions, with many of the factors leading to a massive decline in prices over the past several months remaining firmly in place. During the week, the current economic downturn continued to suggest a steep decline in demand, particularly in the industrial sector, with many companies announcing layoffs and closures of manufacturing plants around the country.
Natural gas prices now are likely to end the year lower than they were at the beginning, despite having reached historically high levels of more than $13 per MMBtu as recently as the beginning of July 2008. The spot price at the Henry Hub decreased by $7.52 per MMBtu, or 56 percent, since the peak price of $13.31 reached on July 2. The current Henry Hub price of $5.79 per MMBtu is lower than the level at the first of the year by $2.08 or 26 percent. The volatility in natural gas prices over the course of the year reflects the rapidly changing markets for crude oil and energy products. Reduced prices for natural gas in recent months relate to an improved outlook for supplies, particularly because of reported increases in domestic production at unconventional fields such as the prolific Barnett Shale in Northeast Texas. Through the first 9 months of 2008, domestic production increased 7.2 percent in comparison with the same period in 2007, despite some production being shut-in as a result of hurricanes in September, according to the November edition of EIA’s Natural Gas Monthly.
During the report week, price increases were largest in the Rockies, where the advent of colder weather has eased concerns over an abundance of regional supplies and limited options for storage. At Rockies trading locations, the average price increased on the week by $1.11 per MMBtu, or 23 percent, to $5.87. For supplies moving westward, weekly gains were particularly strong. The price for supply off Northwest Pipeline Corporation in Washington for delivery into Sumas increased by $4.62 per MMBtu to $10.37. The Sumas market price, which was the highest price in the country yesterday (December 16), likely reflected the extreme weather in Seattle, Washington, this week, as well as competition for supplies with consumers in Canada, where the temperature was well below zero degrees. With this significant weekly increase in Rockies prices, the average price in the region was higher than the Henry Hub price by 8 cents per MMBtu, or 1.4 percent. Rockies spot prices are often the lowest in the country, trading this fall at price levels roughly 40 percent below the Henry Hub price.
Although prices in the Northeast were the highest of all regions, averaging $6.58 per MMBtu, the Northeast was the only region where prices declined over the report week. The decline was limited to an average of 4 cents per MMBtu, or less than 1 percent, as temperatures in the Northeast during this report week were not as extreme as in the middle and western portions of the country. Moreover, while the weather was significantly cold, a large electrical outage in New England may have limited demand for natural gas as a fuel for electric generation. The average Northeast price as of yesterday was 84 cents per MMBtu higher than the average Louisiana price. Although this differential has surged often in the winter when temperatures in the Northeast fall and pipeline capacity into the region becomes congested, the recent relatively moderate temperatures have limited the upward price pressure in this region.
|
|
|
|
At the NYMEX, the price of the near-month contract (for January delivery) decreased 6.7 cents per MMBtu during the report week to $5.619. The decrease was attributed to expected lower consumption as a result of the current economic downturn, as well as a short-term reprieve from the extreme cold experienced in some parts of the country in recent days. The January contract yesterday finished trading at less than 40 percent of its record high price (of $14.52 per MMBtu) established just 5 months ago, prior to the buildup of concerns over the state of the economy and higher-than-average levels of natural gas in underground storage. Downward price pressure also appears related to an improved domestic production outlook and declines in the crude oil price, which decreased this week to its lowest level in more than 4 years. At the end of trading yesterday, the 12-month strip, which is the average for natural gas futures contracts over the next year, was priced at $6.13 per MMBtu, a decrease of about $0.08, or 1.3 percent, since last Wednesday.
|
|
|
|
More Price Data
|
|
| Storage
|
|
|
Working gas in storage totaled 3,167 Bcf as of Friday, December 12, 2008, according to EIA’s Weekly Natural Gas Storage Report (see Storage Figure). The implied net withdrawal for the week of 124 Bcf is the largest yet this heating season, but slightly less than the 128 Bcf that was withdrawn both last year and on average over the past 5 years. The aggregate level of supplies in underground storage now exceeds the 5-year average by 3.7 percent. Although the current aggregate level is below last year’s aggregate level by 1.3 percent, storage levels in the West and East regions of the country exceed last year’s levels by 3.9 and 0.1 percent, respectively. (A description and map of the storage regions are available at http://www.eia.doe.gov/oil_gas/natural_gas/ngs/notes.html.) Only the volume of storage in the Production region is below the volume last year at this time (by 5.9 percent). Because the Producing region includes more salt-cavern facilities (which allow for greater cycling of injections and withdrawals than reservoirs or aquifers), storage levels in this region may reflect more short-term trading opportunities, rather than preparations to meet space-heating seasonal demand.
This week’s withdrawal from storage reflects a number of market conditions. During the week ending Friday, December 12, significant volumes of natural gas were still shut-in because of damage caused by hurricanes in the fall. During the week ending December 12, an estimated 10.5 Bcf of potential supplies was shut-in in the Federal offshore Gulf of Mexico, possibly requiring industry to withdraw more from storage than they would have otherwise. Another likely factor influencing the size of the withdrawal was colder-than-average weather during the week in all regions east of the Rocky Mountains. As indicated by National Weather Service degree-day data, the number of heating degree-days totaled 9.6 percent above normal for the country as a whole, with regional differences of as much as 21 percent higher than average. In general, the average overall temperature for the week was 35.9 degrees Fahrenheit, about 2.7 degrees below normal (see Temperature Maps and Data).
|
|
|
|
More Storage Data
|
|
|
Other Market Trends
|
|
EIA Releases the Reference Case for the 2009 Annual Energy Outlook. On Wednesday, December 17, the Energy Information Administration (EIA) published the 2009 Annual Energy Outlook Early Release (AEO2009), which presents the reference case results for long-term projections of energy supply, demand, and prices through 2030. The results, which are estimated using EIA’s National Energy Modeling System, show that total U.S. energy demand is projected to increase from 101.9 quadrillion Btu per year (quads) to 113.4 quads between 2007 and 2030, increasing at an average annual rate of 0.5 percent. According to the reference case, natural gas consumption is projected to increase from about 23.1 trillion cubic feet (Tcf) in 2007 to 24.4 Tcf in 2030. The full publication, including complete documentation and more than 30 additional cases examining energy markets, will be released in early 2009. According to the AEO2009 reference case:
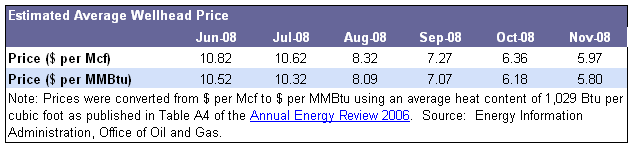
- The price of natural gas at the wellhead (in 2007 dollars) is expected to decrease to $5.73 per Mcf in 2009, reaching their lowest level, and remain in the $5 to $6 range until 2012, when they rise to $6.07 per Mcf. For the remainder of the projection period (thorough 2030), wellhead prices are expected to increase virtually every year, to reach $8.39 per Mcf in 2030.
- Total dry natural gas production is projected to increase from 19.3 Tcf in 2007 to 20.3 Tcf in 2010. While production is projected to fluctuate somewhat between 2007 and 2030, it is expected to exceed 21.0 Tcf in 2020 and increase each year to reach 23.6 in 2030. According to the AEO2009, total dry natural gas production will grow at an average rate of 0.9 percent each year between 2007 and 2030.
- Total net natural imports are expected to decrease from 3.8 Tcf in 2007 to 2.2 Tcf in 2012 and then grow between 2013 and 2017, reaching 2.4 Tcf in that year. Following 2017, net imports are projected to decrease through 2030, reaching 0.7 Tcf in 2030. The decrease in net imports, including pipeline and liquefied natural gas imports, is projected as a result of the expected increase in domestic production, which would decrease the natural gas import share of total supply.
EIA Announces New Release Time for Weekly Publications: On December 15, 2008, the Energy Information Administration (EIA) announced that it will restore the standard release time of the Natural Gas Weekly Storage Report (WNGSR) and Weekly Petroleum Status Report (WPSR) to 10:30 a.m. (Eastern Time). EIA delayed the release time for both publications in June 2008 as a precautionary step to ensure that the data remain physically inaccessible before the release time. EIA loads these reports behind an electronic ‘‘gate’’ that prevents access to the data before the release time. At the release time, the gate is removed, and interested parties can access the information. Over the past several months, EIA has thoroughly tested its electronic gate system and eliminated all identified problems, materially reducing the likelihood of an inadvertent early release of either weekly product. Therefore, on January 7 and 8, 2009, the standard release time of the WPSR and WNGSR, respectively, will return to the original time of 10:30 a.m. The official release schedules are available for the WPSR at http://www.eia.doe.gov/oil_gas/fwd/wpsrsch.html and for the WNGSR at http://www.eia.doe.gov/oil_gas/natural_gas/ngs/schedule.html. These changes to the release times do not reflect EIA's response to comments received as a result of the October 15, 2008, Federal Register notice that requested public input on the process and technologies used for disseminating the WNGSR and the WPSR. The public comment period closed on November 14, 2008. The comments received are posted at http://www.eia.doe.gov/neic/press/fedreg_oct08comments.pdf and currently under review.
NARUC Releases New Report on Utility Bill Arrearages. The National Association of Regulatory Utility Commissioners (NARUC) released survey results on December 17, 2008, which report that about one in five electricity and natural gas customers were overdue on their monthly utility bills. The survey stated that as of May, 22 percent of electricity customers and 21 percent of natural gas customers were in arrears on their bills in the States covered by the survey. Consumers owed utilities about $4.2 billion for unpaid electric service and almost $4.5 billion in overdue natural gas bills, according to the 2008 NARUC Collections Survey Report. The survey, which is based on data reported by 41 States and the District of Columbia, represents more than half of residential utility customers in the United States. The 41 States participating in the 2008 NARUC survey reported data on 43.7 million electric customers, 26.8 million natural gas customers, and 26.0 million combination customers who receive both electric and gas service. The report is a snapshot of regulated utility arrearages and terminations from October 2007 and May 2008, before and after the past winter heating season (November 1, 2007–March 31, 2008). According to NARUC, many States gather some data on arrearages; however, not all do so in the same manner and some States do not have any of this information available. As a result, the data available cannot be easily aggregated for use on the national level.
|
|
|
Natural Gas Transportation Update
|
|
- Enterprise Product Partners, operator of Independence Hub, announced that scheduled volumes fell from 875 MMcf per day to 98 MMcf per day on December 15, as a result of scheduled maintenance to replenish its monoethylene glycol (MEG) supply. MEG is used to inhibit the formation of natural gas hydrates (methane ice) in long pipelines that transport natural gas from production fields to onshore processing facilities. The maintenance lasted less than 24 hours.
- As a result of severe cold weather that moved into the Pacific Northwest over the past weekend (December 12-14), Northwest Pipeline Company declared a Stage II operational flow order (OFO) with an 8-percent imbalance tolerance for all receiving parties north of the Plymouth compressor station in Washington. The OFO became effective on Saturday, December 13, and will remain in effect until further notice. The pipeline also reminded shippers that an OFO for the Kemmerer compressor station in Wyoming remained in effect.
- Trunkline Gas Company announced an unplanned maintenance on December 13 at the Kaplan compressor station in Louisiana. The compressor station experienced a turbine outage that will limit nominations to 250,000 decatherms per day until further notice.
- Panhandle Eastern Pipe Line Company reported an outage at the Liberal compressor station unit 319 in Kansas on December 16 necessary to replace a power turbine. The outage is expected to last 8 days and will limit the capacity of the station to 800 MMcf per day.
See Weekly Natural Gas Storage Report for additional Natural Gas Storage Data.
See Natural Gas Analysis for additional Natural Gas Reports and Articles.
See Short-Term Energy Outlook for additional Natural Gas Prices, Supply, and Demand.
|
|