Natural Gas Weekly Update Text
Released: June 19, 2008
Next Release: June 26, 2008 |
|
|
|
|
Overview
|
|
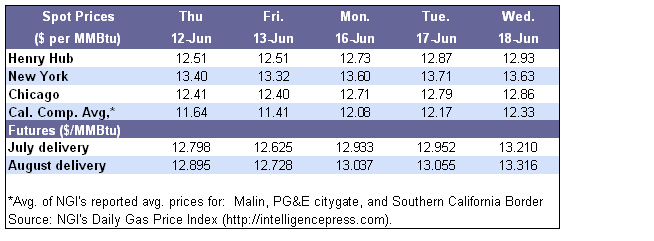
- Since Wednesday, June 11, natural gas spot prices increased at all markets in the Lower 48 States except one, despite the lack of weather-related demand in much of the country. The restoration of production at the Independence Hub to the level prevailing prior to the April 8 shut-in had limited effect on prices. For the week, the Henry Hub spot price increased 44 cents to $12.93 per million British thermal units (MMBtu).
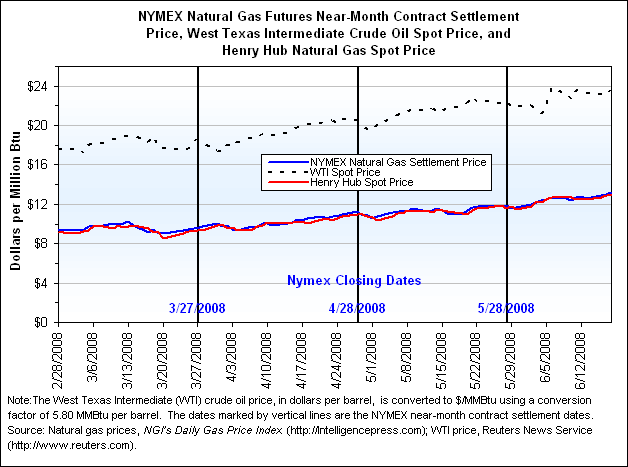
- At the New York Mercantile Exchange (NYMEX), prices also increased on the week, with the weekly increase of the near-month contract exceeding those observed at spot market locations in the eastern half of the country. The futures contract for July delivery rose 55 cents per MMBtu on the week to $13.210, the first time a near-month contract exceeded $13 per MMBtu since December 2005.
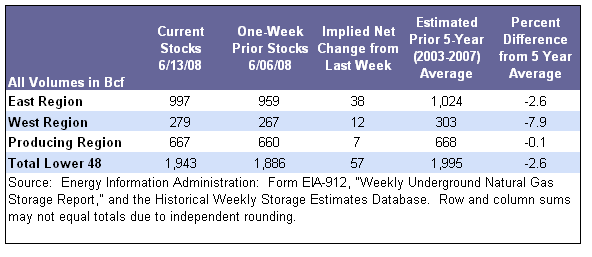
- For the week ended Friday, June 13, natural gas net injections into underground storage were 57 Bcf. With the latest net injections, inventories now stand at 1,943 Bcf, which is 2.6 percent below the 5-year average.
- The price of crude oil continued to climb, trading yesterday at $136.54 per barrel or $23.54 per MMBtu. The net weekly increase in the price of crude oil occurred despite decreases in three of the five trading sessions during the report week. Yesterday’s crude oil price was $0.11 per barrel higher than last Wednesday’s price of $136.43.
|
|
|
|
|
More Summary Data
|
|
| Prices
|
|
|
Natural gas spot prices increased at all market locations with the exception of Iroquois Zone 2 location in the Northeast, which decreased only slightly on the week. Moderate weather in much of the country this week appeared to have little effect on spot prices. Despite the weather, areas where moderate temperatures prevailed still experienced price increases. For example, in the Northeast, where much of the week was marked by temperatures more akin to May than to mid-June, prices climbed by an average of 26 cents per MMBtu. Every market location in the region was trading above $13 per MMBtu yesterday.
West of the Rocky Mountains, where high temperatures created significant demand for space cooling, prices increased between 64 cents and $1.06 per MMBtu on the week. Furthermore, El Paso Natural Gas Company declared a strained operating condition as a result of excess drafting on its system, leading to three consecutive daily price increases at that location, with price gains as high as $1.11 per MMBtu in Monday’s trading.
Production at the Independence Hub in the deepwater Gulf of Mexico has returned to pre-shut-in levels. On Monday, June 16, Independence Hub produced 944 million cubic feet (MMcf) of natural gas. The production level decreased somewhat over the past 2 days, but the latest data from Bentek Energy, LLC, indicate that production at the hub was 879 MMcf per day yesterday.
Despite the restoration of Independence Hub production, natural gas spot markets in the producing region along the Gulf Coast all recorded price increases on the week. The Henry Hub spot price increased 44 cents to $12.93 per MMBtu as of yesterday. Other trading locations in Louisiana also recorded increases that averaged 37 cents, with 11 out of the 17 trading locations trading within 20 cents of $13 per MMBtu. Other locations along the Gulf Coast recorded similar increases that ranged between 18 and 46 cents per MMBtu.
|
|
|
|
At the NYMEX, the futures contract for July delivery at the Henry Hub settled yesterday at $13.210 per MMBtu, after increasing 55 cents or 4.3 percent on the week. Yesterday’s July 2008 price was the highest price recorded for a near-month contract since the January 2006 contract settled at $14.271 per MMBtu on December 21, 2005. It was also the first time since then that a near-month contract exceeded $13 per MMBtu.
The July contract increased in four trading sessions this week with similar price movements for contracts for delivery though the next heating season, indicating an expectation of tight supplies in the future. With the relatively low volumes of liquefied natural gas imported so far this year, lower-than-average working gas in storage, the uncertainty related to possible hurricane activity over the next several months, and the expectation that crude oil prices will remain high, natural gas futures prices continued their upward trend. Current moderate temperatures in some regions and expected improvements in hydro-power activity in the middle of the Lower 48 States were unable to put any significant downward pressure on futures prices.
Futures contracts for the upcoming heating season (November to March) are trading at an average of $13.936 per MMBtu, recording an increase of 59 cents since Wednesday, June 11. At this price level, the heating season contracts as of yesterday were trading at a $1.00 per MMBtu premium to the Henry Hub spot price. By contrast, the heating season strip traded at a premium of nearly $2.00 a year ago. The relatively low premium currently observed lowers the economic incentive to inject natural gas into underground storage.
|
|
|
|
More Price Data
|
|
| Storage
|
|
|
Working gas in storage totaled 1,943 Bcf as of Friday, June 13, which is about 2.6 percent below the 5-year average inventory level for the report week, according to EIA’s Weekly Natural Gas Storage Report (see Storage Figure). During the week, the implied net injection of 57 Bcf was 37 percent less than both the 5-year average and last year’s injection, both of which were 90 Bcf. As of June 13, stocks were 376 Bcf lower than last year’s level and 52 Bcf lower than the 5-year average.
Despite working gas levels below historical levels for this time of year, temperatures and uncertainty about price trends may have contributed to the below-average injection. During the report week, temperatures in the Lower 48 States were above normal everywhere but in the Mountain Census Division, based on degree-day data from the National Weather Service. Temperatures were especially severe in the regions along the Gulf Coast, with average daily temperatures in excess of 80 degrees. Temperatures also were significantly above normal in the New England and Middle Atlantic Census Divisions, which recorded significant space cooling demand. This likely contributed to the 38-Bcf injection in the East Region, sharply contrasting with the 59-Bcf 5-year average net injection for this region and last year’s addition of 60 Bcf. The difference between spot and futures prices for delivery next winter also may be contributing to lower-than-normal injections as it is well below the level of last year. Given the uncertainty surrounding spot and futures price trends, operators may be less aggressive than normal in filling storage at present. (Temperature Maps and Data)
|
|
|
|
More Storage Data
|
|
|
Other Market Trends
|
|
EIA Reports the Major Assumptions of Annual Energy Outlook 2008. The Energy Information Administration (EIA) released a report on June 17, 2008, that detailed major assumptions used in the National Energy Modeling System (NEMS) to generate the projections in the Annual Energy Outlook 2008. The Annual Energy Outlook 2008 provides long-term projections of domestic energy markets to 2030. The report, titled Assumptions to the Annual Energy Outlook 2008, describes general features of the NEMS structure, assumptions concerning energy markets, and the key input data and parameters that are the most significant to the model results. NEMS comprises 12 modules that represent the individual supply, demand, and conversion sectors of domestic energy markets in addition to international and macroeconomic modules. The modules interact chiefly through values representing the prices of energy delivered to the consuming sectors and the quantities of end-use energy consumption. The information also includes other data such as economic activity, domestic production, and international petroleum supply availability. For example, the Oil and Gas Supply Module captures the interrelationships among the conventional and unconventional oil and natural gas supply sources by analyzing cash flow and profitability to compute investment and drilling for each of the supply sources. The model is based on crude oil and natural gas costs and operations data. Key assumptions include the domestic recoverable resource base, rates of technological progress, supplemental gas supplies over time, and natural gas import and export capacities.
EIA Releases an Article on Costumer Choice Programs. EIA released the latest article in its Energy in Brief series on June 17, 2008, titled What are natural gas customer choice programs? This report describes how choice programs work and provides information on how households and small commercial establishments in some States have the option of purchasing natural gas from an unregulated supplier (marketer) rather than a local utility company. The marketer purchases the gas and provides transportation through a local distribution company (LDC). The LDCs are regulated by State utility commissions and earn a return on the delivery service but cannot earn a profit on the sale of natural gas itself. Most customer choice programs began in the 1990s in an effort to introduce more competition into local energy markets. In 2007, participation in natural gas choice programs reached a record high of 4.6 million out of approximately 35 million residential natural gas customers with access to choice programs. Six States accounted for 90 percent of the residential choice customers in 2007. Georgia by far has the most residents who purchase their gas from local marketers, accounting for 38 percent of the total.
|
|
|
Natural Gas Transportation Update
|
|
- Citing lower linepack and expectations for temperatures to exceed 90 degrees in Florida market areas, Florida Gas Transmission Company (FGT) on Wednesday, June 18, issued an Overage Alert Day, which is a formal notice for implementing restrictions for limiting imbalances between scheduled and actual takes from the pipeline. The tolerance for negative daily imbalances was set at 20 percent. FGT said it would not interrupt previously scheduled market-area non-firm service for Wednesday’s gas day below scheduled quantity.
- Northwest Pipeline Corporation on Wednesday, June 18, issued a flow restriction in response to excess volumes being nominated through its Meacham Compressor Station in northeast Oregon. Northwest said a realignment Operational Flow Order will take effect Thursday, requiring shippers to shift nominations from receipt points south of Meacham to receipt points north of the station until further notice. Northwest said timely nominations for Wednesday’s gas day through Meacham exceeded the station’s operational capacity of 440,000 decatherms per day.
- Southern California Gas Company has reduced withdrawal capacity at its Aliso Canyon facility in Los Angeles County, California. As of Tuesday, June 17, the facility’s capacity was reduced by 750 million cubic feet per day for scheduled maintenance. The work is scheduled to run through July 31.
- On Monday, June 16, Tennessee Gas Pipeline Company added six meters to a list of those where flow will be suspended while the pipeline installs new metering. The new metering is being installed at the Grand Chenier processing plant in southern Louisiana to improve measurement accuracy. The outage will begin at the start of the June 24 gas day and is estimated to last between 48 and 72 hours. Tennessee Gas Pipeline states that the maintenance will affect all flow upstream of the Grand Cheniere plant.
- El Paso Natural Gas Company on Wednesday, June 18, lifted a notice of Strained Operating Condition, which had been triggered early in the week because of low linepack on the pipeline. El Paso noted that corrective actions by customers with regards to the alignment of takes with scheduled supplies had increased system linepack to acceptable operating levels. The company also said that early completion Tuesday evening of San Juan Crossover maintenance had increased north-to-south flexibility.
See Weekly Natural Gas Storage Report for additional Natural Gas Storage Data.
See Natural Gas Analysis for additional Natural Gas Reports and Articles.
See Short-Term Energy Outlook for additional Natural Gas Prices, Supply, and Demand.
|
|