
Overview (Wednesday, February 27, to Wednesday, March 5)
Released: March 6, 2008
Next release: March 13, 2008
·
Since Wednesday,
February 27, natural gas prices increased on both the spot and futures markets.
There were a few scattered exceptions to the increases, but these were mostly
confined to the Northeast.
·
The spot price
at the Henry Hub increased 16 cents per million Btu (MMBtu) or 1.7 percent on
the week, averaging $9.37 per MMBtu yesterday, the highest price since January
2006.
·
Boosted by
record-high crude oil prices and declining working gas in storage, the prices
of natural gas futures contracts increased on the week, reaching levels not
seen in the market in more than 2 years. The price of the futures contract for
April 2008 delivery increased 68 cents per MMBtu to $9.741.
·
Natural gas in
storage was 1,484 Bcf as of February 29, which is 4 percent above the 5-year
average.
·
The spot price
for West Texas Intermediate (WTI) crude oil increased $4.86 per barrel to a new
record-high price of $104.45 per barrel or $18.01 per MMBtu.
Cold weather that blanketed much of the
country, with the exception of the Northeast, as well as the high crude oil
prices, led to price increases at nearly all natural gas spot market locations.
Spot price increases in the Lower 48
States ranged mostly between 20 and 50 cents per MMBtu, although several
trading locations in the Rocky Mountains recorded increases of up to 62 cents
per MMBtu. As of yesterday, the average regional price in the Rockies was $8.69
per MMBtu, the lowest regional price in the Lower 48 States.
The Henry Hub spot price increased 16
cents on the week to $9.37 per MMBtu.
While the weekly price increase at the Henry Hub was comparatively low,
yesterday’s price was the highest for this location since January 3, 2006, when
the Henry Hub spot price reached $9.91 per MMBtu.
Warmer weather in the Northeast during
the report week led to spot prices that were significantly below prices on
Wednesday, February 27. In this
region, price decreases averaged $3 per MMBtu or 19 percent, although several
trading locations, including Algonquin, Iroquois, and Transco Zone 6 (both New
York and non-New York delivery), recorded price declines that exceeded $4 and
reached as high as $8.02 per MMBtu. Despite these sizeable decreases, 10 out of
13 locations in the Northeast traded at $10 or more per MMBtu yesterday, and
the Northeast had the highest regional spot prices in the Lower 48 States.
Boosted by rising crude oil prices and declining
working gas in storage, the NYMEX futures contract for April delivery at the
Henry Hub settled yesterday, March 5, at $9.741 per MMBtu, after increasing 68
cents or 7.5 percent on the week. Yesterday’s settlement price for the
April 2008 contract was the highest near-month settlement price since the
February 2006 contract settled at $10.197 per MMBtu on January 4, 2006. During
the first week of trading as the near-month contract, the price of the April
2008 contract increased in three out of five trading sessions.
Prices for contracts in the other
refill season months of 2008 increased across the board with the
May-through-October futures strip gaining about 65 cents per MMBtu, or about 7 percent
since last Wednesday. As of
yesterday, the price of the refill-season-contract strip (April-October) was
$9.871 per MMBtu. With storage levels likely to finish the current heating
season below last year’s levels, demand for gas for underground storage
injections between April and October is expected to exceed that of last year.
The current higher prices for future deliveries reflect the expected tightness
in the natural gas market over the next 6 months, which results from the
significant volume of natural gas that will be required for storage injection.
Recent Natural Gas Market Data
Working gas in storage decreased to 1,484 Bcf as of
Friday, February 29, according to the EIA Weekly
Natural Gas Storage Report (see Storage Figure). Storage inventories are currently 4.4 percent above
the 5-year average, but about 10 percent below last year’s storage level at
this time. The implied net withdrawal of 135 Bcf is 22 percent more than the
5-year average withdrawal of 111 Bcf and about 36 percent higher than last
year’s withdrawal of 99 Bcf. With the latest net withdrawal of 135 Bcf, this
year’s natural gas volume in storage already has dipped below last year’s low
of 1,511 Bcf, which was reported for the week ending March 23, 2007.
The East and Producing regions recorded net
withdrawals that were 24 and 64 percent, respectively, higher than the 5-year
average withdrawals for the week. The relatively large drawdowns
of gas reflect the impact of the unusually cold temperatures during the week,
which kept demand for heating relatively high.
For the week ending February 28, temperatures were 13.3 percent colder
than normal and about 10 percent colder than last year, according to degree-day
data published by the National Weather Service. All of the Census Divisions,
with the exception of the Mountain and Pacific Census Divisions, experienced
temperatures that were colder than normal (see Temperature Maps and Data). The Census Divisions with large
population centers that consume large volumes of natural gas for space heating,
such as the East North Central and Middle Atlantic, recorded temperatures that
were between 10 and 22 percent colder than normal.
Below-average net withdrawals of 7 Bcf occurred in
the West region as temperatures were at or warmer than normal. The relatively small withdrawal reduced the
difference between current and last year’s volumes in the region. However, as
of last Friday, the 189 Bcf being stored in the West region was still 11.7
percent below the 5-year average for the region.
Other Market Trends:
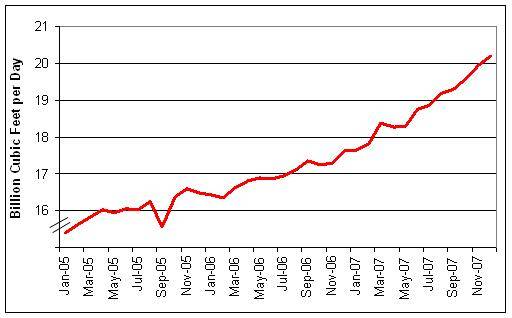
Gross Natural Gas Production in Texas
Exceeds 20 Bcf per Day. In December
2007 gross withdrawals of natural gas in Texas hit their highest production level
since the data series began in 1991. Gross withdrawals reached 20.2 Bcf per day
in December, which was about 14.5 percent higher than the year-ago production
volume of 17.6 Bcf per day. Texas recorded an 11.2-percent increase in annual
gross production in 2007 compared with 2006, reaching 6.9 Tcf (18.9 Bcf per
day) in 2007. Factors contributing to
the increased production include increased drilling activity and continued
success from unconventional resources. While the State is considered a mature
producing area, exploration and production of unconventional gas resources,
such as the Barnett Shale in northeastern Texas, play a major role in natural
gas production. Production from unconventional resources, including coalbed
methane, tight sands, and gas shales, make up the largest portion of production
in the onshore Lower 48 States. According to EIA’s Annual Energy Outlook 2008, unconventional resources are projected
to account for 8.73 Tcf or 57.5 percent of total Lower 48 onshore production in
2007.
Since
January 2005, Texas gross withdrawals have exhibited a generally increasing
trend, with the exception of a significant dip in September 2005 that resulted
from the production disruption associated with hurricanes Katrina and Rita. As
a result, State gross production fell to 15.6 Bcf per day in September 2005, a
4.1-percent decline from the preceding month’s level, but it returned to
pre-hurricane levels by October 2005 (16.4 Bcf per day). Texas annual gross
production totaled 5.8 Tcf (16.0 Bcf per day) in 2005, followed by 6.2 Tcf
(16.9 Bcf per day in 2006.
Drilling
activity in Texas increased during this time, when the average number of oil
and gas rigs drilling climbed 21 and 22 percent in 2005 and 2006,
respectively. The rate of increase in
rigs in Texas hit a peak in early 2007, from which it declined and then leveled
off during the final 8 months of the year.
The average rig count in Texas grew about 1 percent between 2006 and
2007. According to Baker Hughes, Incorporated, the weekly average number of
rigs drilling in Texas was 748 in 2007, which was on average 2 rigs more per
week than in 2006.
For
more information on the latest natural gas data, see the February 2008 edition
of the Natural Gas Monthly. Additional data on gross natural gas
production can be found in the Form EIA-914 Monthly Natural Gas Production Report.
EIA Releases Updated Report on Imports and Exports. The Energy
Information Administration (EIA) has released a special report titled U.S. Natural Gas
Imports and Exports: 2006, which examines recent trends in U.S.
international trade of natural gas. In 2006, when U.S. natural gas consumption
and prices decreased, international supplies of natural gas to the United
States also fell. The United States imported natural gas from six different
countries and exported natural gas to three countries. In 2006, net imports to the United States totaled 3,462 Bcf, a decrease of 150
Bcf, or 4.2 percent, from the previous year, and net U.S. exports to Mexico and
Japan declined by 5 Bcf. As in years past, the U.S. imports came
primarily via pipeline from Canada (85.8 percent of total imports). However, import volumes from Canada fell by
110 Bcf to 3,590 Bcf. The average price
for all U.S. imports declined to $6.72 per million British thermal units or
$6.88 per thousand cubic feet). Imports
of liquefied natural gas (LNG) declined 7.6 percent from the 2005 level to 584
Bcf. Although LNG imports declined
during 2006, the industry continued with plans to expand infrastructure in the
United States in anticipation of bringing LNG from a variety of countries.
The report includes extensive historical tables with natural gas import and
export data through 2006 for both pipeline and LNG trade.
EIA Releases Revised Annual Energy Outlook 2008. The Energy Information Administration (EIA)
on March 4 released a revised Annual Energy
Outlook 2008 (AEO2008) reference case. The revised analysis replaces the early
release version issued shortly before the December 2007 enactment of the Energy Independence and Security Act of 2007
(EISA2007) and includes the impact of that enactment. In the AEO2008 reference case, real
world crude oil prices (defined as the price of light, low-sulfur crude oil
delivered in Cushing, Oklahoma, in 2006 dollars) decline gradually from current
levels to $57 per barrel in 2016 ($68 per barrel in nominal dollars),
thereafter rising to $70 per barrel. The real wellhead price of natural gas (in
2006 dollars) is expected to decline from current levels through 2016, as new
supplies enter the market. After 2016, real natural gas prices rise to $6.56
per thousand cubic feet in 2030. The higher prices reflect an increase in
production costs and the higher oil prices.
Total consumption of
natural gas is projected to increase from 21.7 trillion cubic feet (Tcf) in 2006
to 23.9 Tcf in 2016, then decline to 22.7 Tcf in 2030. Under current laws and regulations, natural
gas is expected to lose market share to coal in the electric power sector as a
result of continued increase in natural gas prices in the latter half of the
projection and slower growth in electricity demand.
Total domestic natural gas
production, including supplemental natural gas supplies, increases from 18.6
Tcf in 2006 to a projected 20.1 Tcf in 2022 before declining to 19.6 Tcf in
2030. While onshore conventional production is expected to decline steadily,
lower-48 offshore production peaks in 2017. Lower-48 production of
unconventional natural gas, particularly gas from shale, is expected to be a
key contributor to growth in U.S. natural gas supplies, increasing from 8.5 Tcf
in 2006 to 9.5 Tcf in 2030. The Alaska natural gas pipeline is expected to be
completed in 2020, later than previously anticipated, because of delays in the
resolution of issues between Alaska’s State Government and industry participants.
Net pipeline imports of
natural gas in the AEO2008 reference case fall from 2.9 Tcf in 2006 to a
projected 0.3 Tcf in 2030, reflecting both resource depletion in Alberta and
Canada’s growing domestic demand. Total net imports of liquefied natural gas
(LNG) to the United States are expected to increase from 0.5 Tcf in 2006 to 2.8
Tcf in 2030. The future direction of the global LNG market, with many new
international players entering LNG markets and strong competition for available
supply, is one of the key uncertainties in the AEO2008 reference
case.
The complete AEO2008,
which EIA will release in April, includes a large number of alternative cases
intended to examine uncertainties surrounding the projections.
Natural Gas
Transportation Update:
·
Mississippi
River Transmission Corporation (MRT) issued a system protection warning (SPW)
March 4 and until further notice. The
warning was issued as a result of forecasted cold weather. During the SPW, MRT will not schedule volumes
that might result in a daily short position.
If actual deliveries exceed scheduled volumes, shippers may be required
to add supply or reduce their takes from MRT.
·
Trunkline Gas
Company announced that on March 4 and 5, it will be inspecting the Quicksand
Creek Lateral in southwestern Louisiana
for corrosion and defects, a procedure known as “pigging.” During that time,
four meters will be shut in.
·
Questar Pipeline
Company announced that it will be performing a required water washing of all
three units at its Oak Spring compressor station in Carbon County, Utah. To
facilitate the work, the main line 104 capacity will be reduced to 400,000
decatherms (Dth) per day for gas day March 18 and to 290,000 Dth per day for
March 19 and 20.
·
TransColorado
Pipeline between the TransColorado/REX Love Ranch interconnect and Greasewood
Compressor Station (Segment 180) in northwestern Colorado has been temporarily
shut in and isolated for emergency repairs. Consequently, some pipeline
interconnects have been shut in until further notice. TransColorado is working
with point operators and does not anticipate any impact to shippers.