
Overview:
Thursday, January 25, 2007 (next release 2:00 p.m. on February 1, 2007)
Natural
gas spot prices across the country surged this week (Wednesday-Wednesday,
January 17-24) as a blast of Arctic cold covered the Lower 48 States, reaching as
far south as Texas. Prices in some gas-consuming markets in the Northeast were
the highest in the country at more than $10 per MMBtu by the end of the week. But
price effects from the increased heating demand registered in production areas
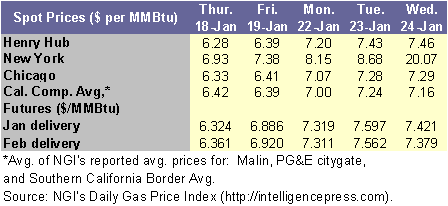
as well. On the week (Wednesday to Wednesday), the spot price at the Henry Hub
increased by $0.89 per MMBtu to an average of $7.46 yesterday (Wednesday,
January 24). At the New York Mercantile Exchange (NYMEX), the price of the
futures contract for February delivery ended trading on Wednesday at $7.421 per
MMBtu, which was $1.187 higher than last Wednesday’s price. As of January 19,
natural gas in storage was 2,757 Bcf, or 20.7 percent above the 5-year average
for this week. Crude oil prices climbed $1.94 per barrel since last Wednesday to
an average of $54.24, or $9.35 per MMBtu.
Strong space-heating demand increased the price of
spot gas across the country, as winter has finally set in after the unusually warm
weather thus far this season. The Henry Hub price rose in four straight trading
sessions for a net gain of $0.89 per MMBtu, or 13.5 percent, for the report
week. Although it is still unclear how long the winter-like temperatures will
remain (some forecasters see above-normal temperatures returning in mid-February),
the recent advent of freezing temperatures has stirred the spot markets. As
often occurs at this time of year, buyers and traders this week moved to cover
positions in localized markets experiencing extreme weather, leading to erratic
pricing patterns across the country. For example, gas buyers resorting to the
spot market for incremental supply in the New York area faced sharp price
increases in the past several days. The price at Transcontinental Gas Pipe Line
Zone 6 in New York increased more than $12 per MMBtu on the week to $20.07.
Meanwhile, in New England, the spot price for delivery off the Algonquin Gas
Transmission pipeline system rose by $6.35 per MMBtu on the week to $13.97
yesterday. Although there are numerous reasons for the price spikes in the
Northeast, a primary consideration likely is congestion along pipelines into
and within the region. In recent days customers with only less expensive
“interruptible” capacity on Northeast pipelines have been confronted with less available
capacity as pipeline usage has increased. Price fluctuations this week were
less severe in the Midwest, where the high for the week at the Chicago citygate
was $7.29 per MMBtu yesterday (Wednesday, January 24), and the net change since
the prior Wednesday was $0.69. In contrast to the large price spikes in the
East, trading in the Rockies and California resulted in only slight price
changes (including declines for the week). The spot price at Opal, Wyoming,
declined $0.22 per MMBtu on the week to $6.57. The price at the Southern California
border increased $0.36 per MMBtu, or 5.3 percent, to $7.09.
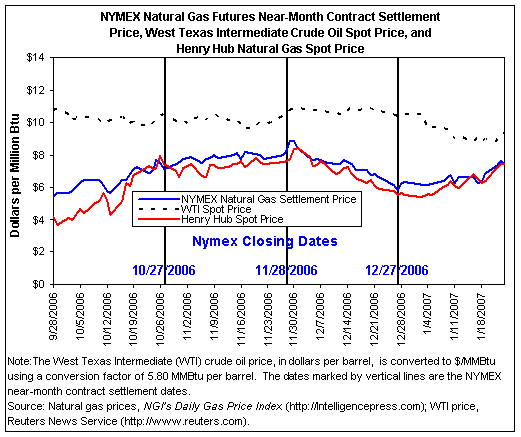
At the NYMEX, the price of
the futures contract for February delivery at the Henry Hub settled at $7.421
per MMBtu yesterday (Wednesday, January 24), increasing $1.187 or about 19 percent
since the previous Wednesday. As was the case in the spot markets, futures
prices increased in four out of five trading sessions this week. However, while
declines characterized the first day of trading in the spot markets this week,
the one session with price declines at the NYMEX occurred yesterday along with
newly-released forecasts for warmer weather returning to the Lower 48 States in
mid to late February. But mid-February is still a few weeks away and the slight
retreat in price yesterday─about 18 cents per MMBtu─may have been simply
a mild break from the vigorous buying in recent trading sessions. The average
increase for the near-month contract during the four trading sessions prior to
yesterday was $0.34 per MMBtu. The price for the March 2006 futures contract
experienced similar increases this week, ending trading yesterday at $7.379 per
MMBtu, or 18.3 percent higher on the week. The 12-month futures strip (February
2007 through January 2008) increased $0.735 per MMBtu (or 10.4 percent) to
$7.768. The futures contracts for much of the season to date have traded at premiums
relative to the Henry Hub spot price. This has provided suppliers economic
incentives to buy gas on the spot market rather than pull from storage.
However, spot prices in recent days have surpassed futures prices slightly: the average Henry Hub price yesterday was
about 4 cents higher than the closing price of the February futures contract.
This relative pricing favors pulling gas from storage rather than paying for
gas on the spot market. Despite higher prices
since last Wednesday, January 17, futures contracts are trading at significant
discounts relative to last year’s hurricane-induced elevated price levels. At
yesterday’s closing price, the February 2007 contract was priced at a $1.26 per
MMBtu discount to the settlement of the February 2006 contract at $8.682 on
January 24, 2006, despite following an extremely warm period during January of
that year.
Recent Natural Gas Market Data
|
Estimated Average Wellhead Prices |
||||||
|
|
July-06 |
Aug-06 |
Sep-06 |
Oct-06 |
Nov-06 |
Dec-06 |
|
5.82 |
6.51 |
5.51 |
5.03 |
6.43 |
6.65 |
|
|
Price
($ per MMBtu) |
5.67 |
6.34 |
5.37 |
4.90 |
6.26 |
6.48 |
|
Note:
Prices were converted from $ per Mcf to $ per MMBtu using an average heat
content of 1,027 Btu per cubic foot as published in Table A4 of the Annual
Energy Review 2002. |
||||||
|
Source: Energy Information Administration, Office
of Oil and Gas. |
||||||
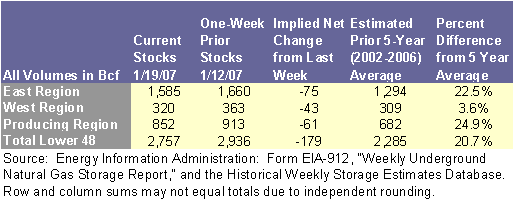
Working
gas in underground storage was 2,757 Bcf or 20.7 percent above the 5-year
average for the week ending January 19, according to EIA’s Weekly Natural
Gas Storage Report (See
Storage Figure). The implied net withdrawal during the
report week was 179 Bcf, which is 19 Bcf more than the 5-year average
withdrawal of 160 Bcf for the week. This
net withdrawal is the largest weekly net withdrawal this
heating season and the largest since December 9, 2005. It ends a string of lower-than-average withdrawals
(based on data from the past 5 years) since the beginning of December 2006. Net
withdrawals of this magnitude are not uncommon, occurring about 10 percent of
the time during the heating season. The
volume of natural gas in storage is still currently 10 percent higher than last
year at this time. In contrast to the relatively large volume of gas in
storage in the East and Producing regions, the overall storage level in the
West is just 11 Bcf, or 3.6 percent, higher than the 5-year average. The trend
of extreme weather conditions in many parts of the West this winter continued
during the report week, resulting in the highest net withdrawal in the region
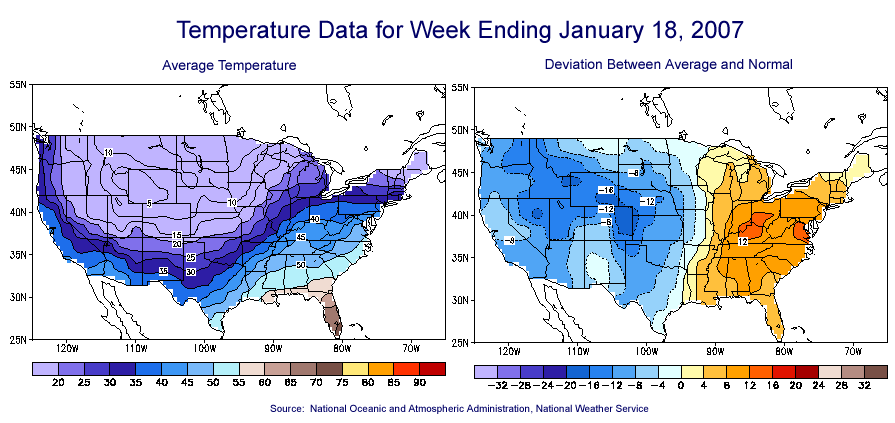
recorded in EIA’s weekly database, which contains data from the last 13 years. Temperatures for the United States as
a whole, as measured by heating degree-days (HDDs), were about 3.9 percent
warmer than normal for the week ending January 18, according to the National
Weather Service (See Temperature Maps).
In particular, warmer-than-normal temperatures continued in key consuming
markets, such as the Middle Atlantic where HDDs were 23 percent below normal.
Other Market Trends:
Natural Gas Rig Count: The number of rigs drilling for natural gas
in the United States increased to a new record high of 1,466 as of Friday,
January 19, 2007, according to Baker-Hughes Incorporated. This record is 16 rigs, or about 1 percent,
higher than the previous record of 1,450, which occurred during the week ending
September 22, 2006, and again during the week ending October 27, 2006. The
current natural gas rig count is 22 rigs higher than last week, and 244 rigs,
or almost 20 percent, higher than the number during this week last year. Of the 1,466 natural gas rigs, 80 are located
in the Gulf of Mexico, which equals last week's Gulf total. The number of natural gas rigs in the Gulf of
Mexico has more than doubled compared with this time last year when several
rigs were damaged by major hurricanes.
However, natural gas rigs in the Gulf of Mexico are still 8 rigs less
than the number drilling during this week in 2004, and well below the record
number of 134 that occurred during July and August of 2000. Of the 1,745 total rigs currently drilling in
the United States, 84 percent are natural gas rigs and 15.8 percent are
drilling for oil.
GAO Reports on DOE Research and Development
Funding: In response to a Congressional request, the Government
Accountability Office (GAO) released a report on January 19, 2007, which
examined the Department of Energy’s (DOE) research and development funding
trends and strategies for developing advanced energy technology. GAO found that DOE’s budget authority for
renewable, fossil, and nuclear energy research and development dropped by more
than 85 percent from 1978 to 2005.
According to the report, energy research and development budget
authority peaked in the late 1970s in response to the oil embargo and then fell
sharply over the next decade as crude oil prices declined. Since fiscal year 2000, however, Federal
support for energy research and development has grown. In fiscal year 2006, Congress provided $982
million in budget authority for energy research and development, including $324
million for renewable energy, $434 million for fossil energy, and about $224
million for nuclear energy. More than 80
percent of the funding for fossil energy research and development has focused
on coal programs, particularly to reduce harmful emissions and increase
efficiency of coal-fired power plants.
Funding for oil and natural gas research and development in recent years
has been mostly accomplished through cost-shared partnerships with industry and
has focused mainly on improving exploration technologies, extending the life of
current reservoirs, and developing advanced drilling technologies. In fiscal year 2005, more than 60 percent of
DOE’s oil and natural gas research and development funding focused on technology
to produce natural gas from methane hydrates, which are found in permafrost
regions and in water depths greater than 1,600 feet. In addition to appropriated funding, oil and
natural gas research and development receives funding under a program established
by the Energy Policy Act of 2005. The
program partly uses income from Federal oil and natural gas leases to focus on
ultra-deepwater and unconventional natural gas and oil exploration.
Natural Gas Transportation
Update: