
| xxxxx
|
| Home > Natural Gas > Natural Gas Weekly Update |
|
Overview:�
Thursday, September 21 (next release 2:00 p.m. on September 28, 2006) Except for some Rocky Mountain markets, natural gas
spot prices decreased significantly in the Lower 48 States since Wednesday,
September 13, reaching the lowest levels in over 2 years at most market
locations.� The spot price at the Henry
Hub dropped 54 cents, or about 10 percent this week (Wednesday to Wednesday, September
13 to 20) to $4.87 per MMBtu.� Similarly,
the price of the New York Mercantile Exchange (NYMEX) futures contract for
October delivery settled at $4.931 per MMBtu yesterday (September 20), which is
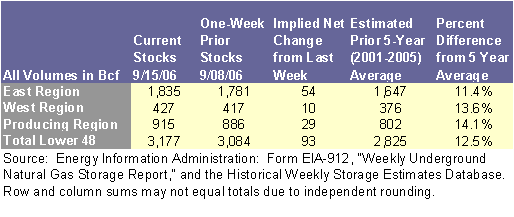
52 cents, or about 10 percent, less than last Wednesday�s price.� As of Friday, September 15, 2006, natural gas
in storage was 3,177 Bcf or 12.5 percent above the 5-year average.� The spot price for West Texas Intermediate
(WTI) crude oil declined $4.09 per barrel this week to $60.00 per barrel or $10.34
per MMBtu yesterday.� ���� A
variety of market influences, including falling crude oil prices, ample natural
gas storage inventories, and moderate weather, placed significant downward
pressure on natural gas spot prices this week.�
Spot market activity since Wednesday, September 13, included a sharp
drop in prices last Friday following the announcement of a larger-than-average
storage injection for the previous week.�
Although prices rebounded on Monday, decreases for the week ranged
between 41 cents and 70 cents per MMBtu at all market locations outside of the
Rocky Mountains.� The Henry Hub spot
price fell to $4.40 per MMBtu on Friday, which is the lowest price since
September 3, 2004, before settling at $4.87 per MMBtu yesterday.� Elsewhere in Louisiana, prices dropped 56
cents on average with an average price of $4.78 per MMBtu yesterday.� The Midcontinent and locations west of the
Rockies saw prices fall below $4 per MMBtu during the week reflecting potential
pipeline imbalances and high inventory Operational Flow Orders (see
Transportation Update below). �Spot
prices in these regions were $4.39 (Midcontinent), $4.70 (California), and
$4.82 (Arizona/Nevada) per MMBtu yesterday.�
In the Rockies, completion of a scheduled pipeline hydro-test ended
significant transportation constraints in this region and prices responded to
the return of unrestricted natural gas flows.�
The spot price at Northwest South of Green River increased 98 cents per
MMBtu, or 32 percent, on the week and the spot price at the Colorado Interstate
Gas market location increased 84 cents, or 26 percent.� The spot price at both of these locations was
$4.01 per MMBtu yesterday.� On average,
natural gas spot prices at all market locations are about $6 per MMBtu less
than at this time last year, and about 60 cents per MMBtu less than this time 2
years ago.
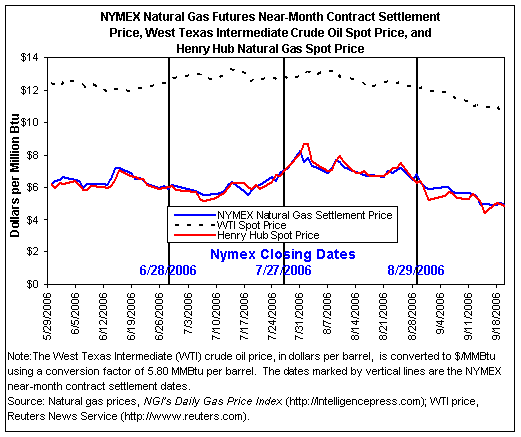
At
the NYMEX, the price of the futures contract for October delivery at the Henry
Hub decreased 52 cents, or about 10 percent, to $4.931 per MMBtu since last
Wednesday, September 13.� The settlement
price on Friday for the October contract was $4.892 per MMBtu, which is the
lowest price for this contract since March 29, 2004, and the lowest price for
any near-month contract since September 16, 2004.� The contracts for the upcoming heating season
(November 2006 through March 2007) fell more dramatically with decreases
averaging $1.15 per MMBtu on the week.�
The average settlement price for these contracts was $7.64 per MMBtu
yesterday.� Despite these significant drops
this week, this price is still $2.77 per MMBtu more than yesterday�s Henry Hub
spot price, which will offer continuing economic incentive to inject natural
gas into storage.� Beyond March 2007, the
contracts for the next year decreased but at more modest increments ranging
between 22 cents and 27 cents per MMBtu.�
The 12-month futures strip (October 2006 � September 2007) settled
yesterday at $7.32 per MMBtu, which is $4.50 less than the equivalent 12-month
strip (October 2005 � September 2006) at this time last year.� Recent Natural Gas Market Data
Working
gas in storage increased to 3,177 Bcf as of Friday, September 15, according to
the EIA Weekly Natural Gas Storage Report
(See
Storage Figure).�
Storage inventories are currently 12.5 percent above the 5-year average
and 12.6 percent above last year�s storage level at this time.� The implied net injection of 93 Bcf is 12.6
percent more than the 5-year average injection of 83 Bcf and about 22 percent
more than last year�s injection of 76 Bcf.�
With almost 6 weeks left before the heating season starts, storage
inventory levels are only 150 Bcf less than the highest level they have reached
since January 1993 when weekly storage data collection began.� This record level occurred in November 2004
when working gas in storage was 3,327 Bcf.�
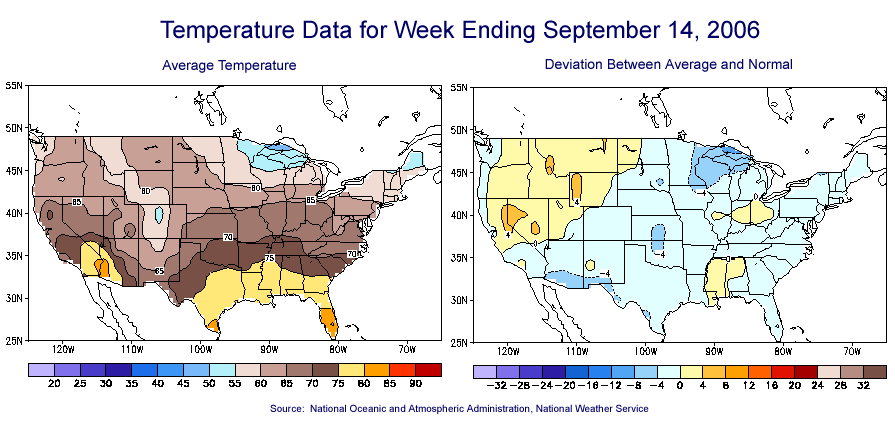
The larger-than-normal injection this week partly reflects moderate
temperatures across the United States, which kept demand for heating and
cooling needs low.� For the week ending
September 14, 2006, temperatures were slightly cooler-than-normal with only 15
heating degree days and 38 cooling degree days for the country as a whole
according to the National Weather Service. �(See Temperature Maps)
Other Market Trends: EIA Releases Report on Storage Capacity Estimates:� The Energy
Information Administration�s (EIA) newly-released report, the Estimates of Maximum Underground
Working Gas Storage Capacity in the United States, examines the
aggregate maximum capacity for U.S. natural gas storage.� There are three types of underground
facilities used for natural gas storage: depleted reservoirs in oil and/or
natural gas fields; aquifers; and salt cavern formations.� In the Lower 48 States, about 123 entities
currently operate about 400 active underground storage facilities.� Although the concept of maximum working gas
storage capacity seems rather straightforward, certain aspects of capacity
measurement and industry operations preclude the determination of a single,
definitive estimate for maximum capacity.�
Even though the fields generally contain peak storage volumes on October
31, some portion of capacity may not be fully utilized when the industry
reaches its collective maximum.�
Underutilization of working gas storage capacity can be partially
explained by a number of factors that are enumerated in the report.� The report examines three alternative
approaches to estimate the volume of natural gas that can be stored in U.S.
underground storage facilities.� A
conservative estimate of maximum capacity is about 3,600 billion cubic feet,
which is approximately equal to the sum of non-coincident peak volumes over all
facilities during the years 2000-2004.�
The report suggests that estimates of maximum storage capacity should be
considered along with the limitations of the estimation approach. Natural Gas
Transportation Update: Lack of significant demand and high levels of
working gas in storage caused several pipelines in the West to issue warnings
reacting to potential imbalances. Southern California Gas Co. declared a
high-linepack operational flow order (OFO) Friday, September 15, which was in
effect until Monday, September 18. The company announced that customers who
deliver more than 110 percent of their scheduled gas usage would be assessed
buy-back charges in accordance with their tariffs. Additionally, Pacific Gas and
Electric Co. declared a systemwide Stage
2 high-inventory OFO Saturday, September 16, and added that penalties of $1 per
decatherm (Dth) would be assessed to shippers exceeding 5 percent tolerance for
negative daily imbalances. The systemwide OFO was in effect until Monday,
September 18.� El Paso Natural Gas Co. declared a systemwide strained operating
condition (SOC) Sunday, September 17, which was effective until Tuesday,
September 19. The pipeline set a 10 percent tolerance for positive daily
imbalances owing to work being done on the Washington Ranch storage facility.
El Paso suspended the maintenance on September 18 in order to allow injections
into the storage facility, and stated that the SOC could be completely lifted
as of September 19 since the storage injections combined with the actions taken
by shippers had contributed to a stabilization of the linepack. | ||||||||||||||||||||||||||||||||||||||||||
| http://tonto.eia.doe.gov/oog/info/ngw/ngupdate.asp | ||||||||||||||||||||||||||||||||||||||||||
phone: 202-586-8800 email: infoctr@eia.doe.gov Specialized Services from NEIC |
||||||||||||||||||||||||||||||||||||||||||
|
phone: 202-586-8959 email: wmaster@eia.doe.gov |
||||||||||||||||||||||||||||||||||||||||||
|
|
||||||||||||||||||||||||||||||||||||||||||
|
|
||||||||||||||||||||||||||||||||||||||||||
|
|
||||||||||||||||||||||||||||||||||||||||||
| . | ||||||||||||||||||||||||||||||||||||||||||
| Renewables | Alternative Fuels | Prices | States | International | Country Analysis Briefs | ||||||||||||||||||||||||||||||||||||||||||
| Environment | Analyses | Forecasts | Processes | Sectors | ||||||||||||||||||||||||||||||||||||||||||