
| xxxxx
|
| Home > Natural Gas > Natural Gas Weekly Update |
|
Overview:�
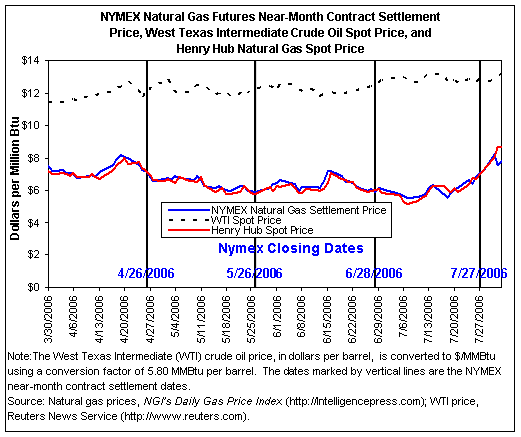
Thursday, August 3 (next release 2:00 p.m. on August 10, 2006) Natural
gas spot prices increased sharply this week (Wednesday-Wednesday, July 26 �
August 2), as demand for power generation remained high in order to meet
air-conditioning load and crude oil continued to trade near record-high prices.
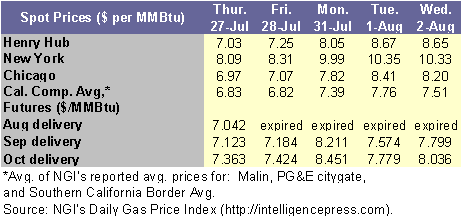
For the week, the price at the Henry Hub increased $1.94 per MMBtu, or about 29
percent, to $8.65. At the New York Mercantile Exchange (NYMEX), the August
contract expired last Thursday, July 27, at $7.042 per MMBtu, about $1.16 more
than the previous month�s settlement. The price of the futures contract for
September delivery at the Henry Hub moved about 83 cents per MMBtu higher on
the week to settle yesterday (Wednesday, August 2) at $7.799. Natural gas in storage was 2,775 Bcf as of
Friday, July 28, which is 19.2 percent higher than the 5-year average. The
spot price for West Texas Intermediate (WTI) crude oil increased $2.34 per
barrel or about 3 percent, since last Wednesday (July 26) to trade yesterday at
$76.16 per barrel or $13.13 per MMBtu. Natural gas prices increased this week as continued scorching heat blanketed most of the Lower 48 States. The Henry Hub price rose in all but one trading session this week, including an increase of 80 cents per MMBtu on Monday, July 31. The Henry Hub price on Tuesday gained an additional 62 cents to average $8.67, which was the highest price for next day delivery at the Henry Hub since February 1, 2006. Other trading locations in producing areas along the Gulf Coast and in West Texas registered significant increases ranging from $0.73 to $3.09 per MMBtu. The extreme heat across the country has lifted demand for natural gas from power generators in order to meet cooling demand. According to data from the Edison Electric Institute, electric energy output has exceeded last year�s levels for the past 2 weeks by 0.7 percent. As electric generation surges, the power-grid operators tend to call on the region�s gas-fueled peaking facilities. Natural gas spot price increases on the week were widespread, with prices at most reporting market locations increasing by more than $1.00 per MMBtu. In the Northeast, temperatures reached over 100 degrees in many consuming areas. The result was this week�s highest price increases in the country at an average of $2.37 per MMBtu. The price for gas off Transcontinental Gas Pipe Line into New York City increased $2.60 per MMBtu, or nearly 34 percent, to $10.33, which is close to a $1.70-premium to the Henry Hub price. Prices increased significantly in the Rockies and the West Coast as well, albeit slightly less so than in the East. The price at the Southern California border increased $0.60 per MMBtu, or 9 percent, to $7.39. Trading locations in the Rockies registered an average increase of $0.55 per MMBtu to trade at an average of $6.76.��
At
the NYMEX, the futures contract for August delivery expired last Thursday, July
27, at a closing price of $7.042 per MMBtu. During its tenure as the near-month
contract, the August contract gained nearly $0.91 per MMBtu, or 15 percent, in
value. The net gain on the month marks only the second time since October 2005
(when the November 2005 contract expired) that a contract�s price has increased
while trading as the near-month contract. The price of the NYMEX futures
contract for September delivery gained close to $0.83 per MMBtu on the week to
settle at $7.799 yesterday (August 2). Prices of futures contracts moved up
this week in response to the current high temperatures, speculation over the
path of Tropical Storm Chris, and �higher
prices for crude oil and petroleum products that compete with natural gas.
Tropical Storm Chris now appears to be weakening as it moves closer to the
Florida Keys, however there has been considerable uncertainty about the
possibility of Chris gaining strength as it enters the Gulf of Mexico. The
price of the September contract has increased in five of the past six trading
sessions. The price increases resulted in the highest price for a near-month
contract ($8.211 per MMBtu on Monday, July 31) since February 3, 2006. However,
the September contract itself has traded at over $9 per MMBtu as recently as
late April. Contracts for the next heating season (November 2006 through March
2007) increased an average of nearly 75 cents per MMBtu to settle at an average
of $10.952, which held a premium of about $2.30 per MMBtu over yesterday�s
Henry Hub cash price. The 12-month strip, which is an average of futures prices
for the coming year, increased 56 cents per MMBtu to $9.556 since last
Wednesday (July 26). Recent Natural Gas Market Data
Working gas in storage as of
July 28 was 2,775 Bcf, which is 19.2 percent above the 5-year average inventory
level for the reporting week, according to EIA�s Weekly Natural Gas Storage Report (See Storage Figure).
The implied net injection of 19 Bcf for the report week was less than one-third
the 5-year average net injection of 62 Bcf and about 49 percent lower than the
last year�s net injection of 37 Bcf. As a result, the difference between this
year�s stocks and the 5-year average has decreased to 447 Bcf, and the
difference between this year�s stock level and last year declined to 360
Bcf.� With the exception of the net
withdrawal reported by EIA for the week ending July 21, this report week�s net
injection of 19 Bcf is the lowest for the Lower 48 States since the first week
of the injection season in April. Cooling demand in key market locations once
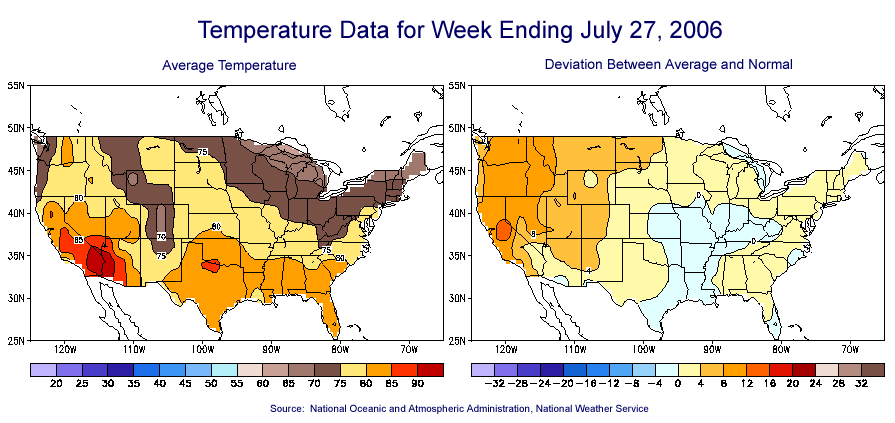
again contributed to reduced net injections, as warmer-than-normal temperatures
were extensive (See Temperature Maps). Temperatures across the Lower 48
States were about 21 percent warmer than normal for the week ending July 28,
according to the number of cooling degree days as measured by the National
Weather Service. Most notably, cooling degree days in the Pacific Census
division were more than double the normal level for week. The Pacific division
includes California, a State with a considerable number of power plants that
are fueled by natural gas.
Other Market Trends: DOE Releases Final Report on the Impact
of the 2005 Hurricanes on the Natural Gas Industry: On July 31, the U.S. Department of Energy (DOE)
released a report titled Impact
of the 2005 Hurricanes on the Natural Gas Industry in the Gulf of Mexico Region, which summarizes DOE�s findings based
on its monitoring of the impact of hurricanes Katrina and Rita on the natural
gas industry from late August 2005 through early March 2006. The 24-page final
report details the extent of damage to the natural gas industry from the two
storms, which together caused the biggest disruption in history to operations
in the Gulf region. Hurricane Katrina and Rita, Category 5 and 4 storms,
respectively, destroyed 113 platforms and damaged 52 others. The hurricanes
also damaged at least 183 offshore pipelines, some of which were large-diameter
pipelines. In comparison, only 7 platforms were destroyed when Hurricane Ivan,
a Category 4 storm affected the Gulf in 2004, as Ivan�s path bypassed the major
production infrastructure. As a consequence of both hurricanes, virtually all
large natural gas processing plants in the area from Galveston Bay, Texas,
through Mississippi were shut down temporarily. A total of 27 plants were affected,
or nearly 75 percent of total processing capacity in the region, and operations
were disrupted at several fractionators (natural gas liquids plants). In its
final shut-in statistics report on June 21, 2006, the Minerals Management
Service (MMS) estimated that about 936 million cubic feet (MMcf) of daily gas
production in the offshore Federal Gulf of Mexico remained shut in, as of June
19, and estimated the cumulative shut-in production at 803.6 billion cubic feet
(Bcf).� The Gulf of Mexico is a major source
of U.S. natural gas. Prior to the hurricanes, the Federal offshore in the Gulf
of Mexico provided about 10 Bcf of gas per day or 20 percent of all the natural
gas produced domestically. National Action Plan for Energy
Efficiency: �The U.S. Department of Energy in a joint
effort with the U.S. Environmental Protection Agency developed the National
Action Plan for Energy Efficiency (NAPEE), which was released on July 31, 2006.
The NAPEE provides energy consumers and providers the necessary information concerning
policies and techniques that are expected to save money and protect the
environment. The action plan was developed by a leadership group of more than
50 organizations, which included 23 electric and natural gas utilities and 16
State agencies. The NAPEE provides five recommendations for helping States and
utility companies overcome policy, regulatory, and other barriers that limit
investment in energy efficiency. The recommendations include:
More than 80 energy,
environmental, and other organizations have declared their support for the new
plan. During the winter of 2006�2007, the leadership group plans to report on
its progress and identify next steps for the action plan. EIA Evaluation of Annual Energy Outlook Projections:� The Energy Information Administration
(EIA) released on Thursday, July 27, an evaluation of the projections published
in the Annual Energy Outlook
(AEO).� This annual publication compares
the projections included in each edition of the AEO since 1982 with realized
energy outcomes.� Each year, the
comparison adds the most recent AEO projections and updates the historical data
to the most recently available.� In order
to summarize the relationship between projected and actual outcomes, EIA uses
the average absolute percent difference for several of the major variables from
the AEO82 through AEO2005.� According to
the evaluation, the projections of energy consumption, energy production, and
carbon dioxide emissions have been relatively close to realized outcomes
(between 2 percent and 7 percent different on average), the projections of net
energy imports have been moderately close to realized outcomes (between 6
percent and 8 percent different on average), and the projections of energy
prices have been the furthest from realized outcomes (between 18 and 83 percent
different on average).� Natural gas, in
general, is the fuel with the largest differences between projected and actual
prices.� The average absolute percent
difference for natural gas wellhead prices over all projections is 65.1
percent.� In previous evaluations, this
percentage has been as high as 82.6 percent.�
EIA explains that regulatory reforms in the mid-1980s, which increased
the role of competitive natural gas markets, made natural gas prices
particularly difficult to predict.� Other
factors leading to the large differential are EIA�s conservative expectation of
technology improvements in early editions of the AEO, and natural gas resource
estimates that steadily rose.� EIA also
notes that external factors such as severe weather, economic cycles, and supply
disruptions have an impact on energy markets that cannot be anticipated in the
long-run and therefore cannot be captured in the AEO model and underlying
assumptions.� Natural Gas Transportation Update:
| ||||||||||||||||||||||||||||||||||||||||||
| http://tonto.eia.doe.gov/oog/info/ngw/ngupdate.asp | ||||||||||||||||||||||||||||||||||||||||||
phone: 202-586-8800 email: infoctr@eia.doe.gov Specialized Services from NEIC |
||||||||||||||||||||||||||||||||||||||||||
|
phone: 202-586-8959 email: wmaster@eia.doe.gov |
||||||||||||||||||||||||||||||||||||||||||
|
|
||||||||||||||||||||||||||||||||||||||||||
|
|
||||||||||||||||||||||||||||||||||||||||||
|
|
||||||||||||||||||||||||||||||||||||||||||
| . | ||||||||||||||||||||||||||||||||||||||||||
| Renewables | Alternative Fuels | Prices | States | International | Country Analysis Briefs | ||||||||||||||||||||||||||||||||||||||||||
| Environment | Analyses | Forecasts | Processes | Sectors | ||||||||||||||||||||||||||||||||||||||||||