
Overview:
Thursday, May 11 (next release 2:00 p.m. on May 18, 2006)
Springtime
temperatures in most regions of the country this week and slightly lower prices
for crude oil led to an easing of natural gas spot prices in the Lower 48 States
since Wednesday, May 3. On the week (Wednesday-Wednesday, May 3-10), the Henry
Hub spot price dropped 6 cents per MMBtu, or less
than 1.0 percent, to $6.50. In contrast to spot market activity, trading of
futures contracts at the New York Mercantile Exchange (NYMEX) this week
resulted in gains. The NYMEX contract for June delivery increased 29.4 cents
per MMBtu on the week to a daily settlement of $6.900
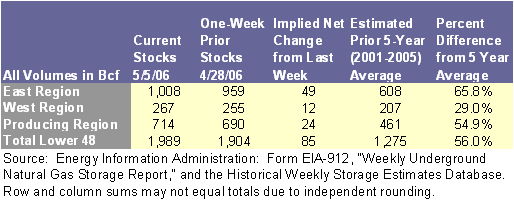
yesterday (May 10). Net injections reported in today’s release of EIA’s Weekly Natural Gas Storage Report
brought natural gas storage supplies to 1,989 Bcf as
of Friday, May 5, which is 56.0 percent above the 5-year average inventory for
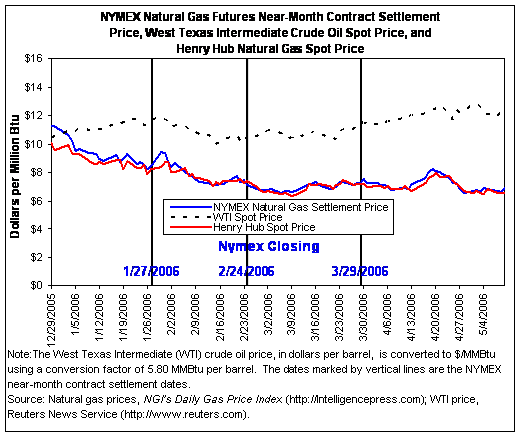
the report week. The spot price for West Texas Intermediate (WTI) crude oil
decreased $0.11 per barrel on the week to $72.15 per barrel, or $12.44 per MMBtu.
Moderate
temperatures this week left prices lower than the previous week at nearly all
market locations across the Lower 48 States. For the week, prices at
production-area trading locations along the Gulf Coast generally decreased
between 2 and 18 cents per MMBtu. The Henry Hub spot
price fell to $6.50 per MMBtu, which is 6 cents lower
than last Wednesday’s level. The largest price decreases on the week were in
West Texas, the Rockies, and California, regions which generally experienced
mild temperatures. The average price at four trading locations in California
yesterday was $5.53 per MMBtu, which was 31 cents lower than the previous
Wednesday. The spot price at the Opal, Wyoming, trading
location fell 23 cents per MMBtu to $5.33, which was
$1.17 less than the Henry Hub price. The
lack of temperature extremes in the Northeast also led to declines, albeit less
than in the West. Prices in the Northeast yesterday (May 10) averaged $6.87 per
MMBtu, or 14 cents lower than the price on the previous Wednesday. The price in
the New York City area off Transcontinental Gas Pipe Line (Transco) has dropped
in four of the five trading sessions this week, ending trading yesterday at
$6.93 per MMBtu, reflecting a total decline for the week of 16 cents per MMBtu or about 2 percent. There were several exceptions to
the general decline, notably for markets located along paths to Florida, where
hot temperatures continue to boost prices. On Tuesday, May 9, Florida Gas
Transmission alerted shippers to keep gas flows balanced during expected
periods of high demand.
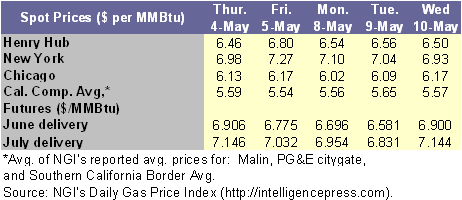
NYMEX futures prices increased this week, in part
owing to large gains yesterday (May 10) that reversed consecutive declines in
the previous three sessions. The near-month contract (for June delivery)
increased on the week by 29.4 cents per MMBtu, or 4.5 percent, as it settled
yesterday at $6.900. The price of the near-month contract ended yesterday
$0.298 per MMBtu lower than the May contract’s final settlement price of
$7.198. Nonetheless, the June contract price was still higher (by almost 78
cents per MMBtu) than the final settlement price of $6.123 for the June 2005
contract. Prices for futures contracts for the next heating season (November
2006 – March 2007) continue to trade at a large premium to current prices,
providing a substantial incentive to store gas for next winter. The prices for
contracts for the next heating season yesterday averaged $10.986 per MMBtu,
which was $4.486 more than yesterday’s Henry Hub spot prices. The 12-month strip, which is the average price for futures
contracts over the next 12 months, closed yesterday at $9.274 per MMBtu, an
increase of 24.6 cents since last Wednesday.
Recent Natural Gas Market Data
|
Estimated Average Wellhead Prices |
||||||
|
|
Nov-05 |
Dec-05 |
Jan-06 |
Feb-06 |
Mar-06 |
Apr-06 |
|
9.54 |
10.02 |
8.66 |
7.28 |
6.52 |
6.59 |
|
|
Price
($ per MMBtu) |
9.29 |
9.76 |
8.43 |
7.09 |
6.35 |
6.42 |
|
Note:
Prices were converted from $ per Mcf to $ per MMBtu using an average heat
content of 1,027 Btu per cubic foot as published in Table A4 of the Annual
Energy Review 2002. |
||||||
|
Source: Energy Information Administration, Office
of Oil and Gas. |
||||||
Working
gas in underground storage was 1,989 Bcf as of May 5, which is 56.0 percent
above the 5-year average inventory level for the report week, according to
EIA’s Weekly Natural Gas Storage Report
(See Storage Figure). The net change marks the largest
net injection this year. The implied net injection for the week was 85 Bcf,
which is 21 percent higher than the 5-year average net injection of 70 Bcf and
63 percent higher than last year’s net injection of 52 Bcf. As a result, the
difference between current inventory levels and the 5-year average increased to
714 Bcf and the difference between current inventories and last year’s level
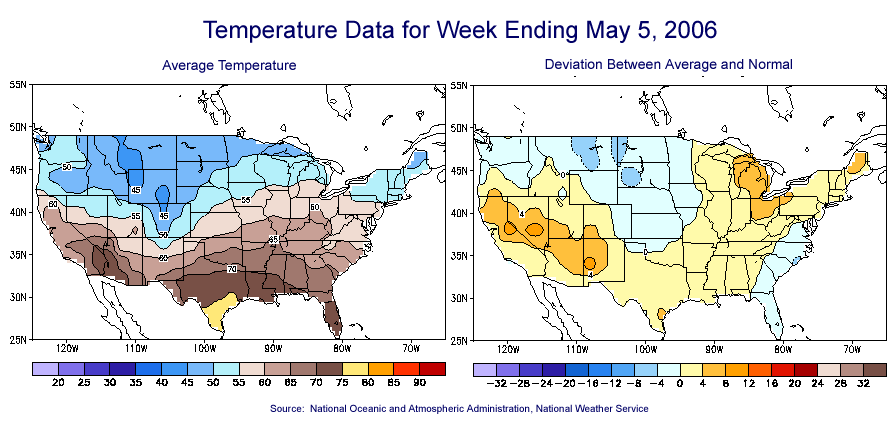
expanded to 488 Bcf. The latest heating- and cooling-degree day statistics
published by the National Weather Service for the period roughly coinciding
with the week covered by this storage report show that weather-related gas
demand was minimal relative to the peak periods in the summer and winter,
limiting any heating- or cooling-load demand (See Temperature
Maps). Only
the New England and South Atlantic Census divisions had greater-than-normal
heating degree days (HDD), with HDDs numbering 6 and 9 percent higher than
normal, respectively. As to cooling degree days (CDD), some divisions showed
large percentage differences from normal, but the actual CDD levels were
relatively low compared with summer levels and therefore do not represent
significant cooling demand.
Other Market Trends:
EIA’s
Short-Term Natural Gas Outlook: According to the agency’s Short-Term
Energy Outlook, released
May 9, 2006, the Energy Information Administration (EIA) expects that total
U.S. natural gas consumption in 2006 will fall by about 240 Bcf, or 1.1 percent
below 2005 levels, owing largely to the reduced heating demand during the
unusually warm early months of the year. However, the decrease in 2006 is
expected to be offset by a 700 Bcf increase in 2007, when total natural gas
consumption is expected to amount to about 22.5 Tcf. The largest year-on-year
increase is projected to occur in the residential sector (325.4 Bcf), followed
by the industrial sector (201.7 Bcf), and the electric power sector (139.8
Bcf). Domestic dry natural gas production is projected to increase by 0.8 and
1.6 percent in 2006 and 2007, respectively, while liquefied natural gas (LNG)
imports also are expected to increase, growing to 740 Bcf in 2006 and 970 Bcf
in 2007. The expected decline in consumption of natural gas during 2006 will
lead to a 9.9-percent decrease in the average annual Henry Hub spot price,
which averaged $9.00 per Mcf in 2005 and is expected to average $8.11 per Mcf
in 2006 and $9.17 per Mcf in 2007. Concerns
about potential future supply tightness and continuing pressure from high crude
oil prices will likely lead to higher natural gas spot prices next winter, with
the Henry Hub spot price projected to increase to just under $11.00 per Mcf.
Natural gas inventories in underground storage are projected to reach about
3,444 Bcf by the beginning of the 2006-2007 heating season (November 1, 2006),
which is 250 Bcf or 7.8 percent higher than the natural gas stocks at the onset
of the 2005-2006 heating season.
MMS Releases a
Report on Deepwater Activity in the Gulf of Mexico: In early May,
the Minerals Management Service (MMS) released a report entitled Deepwater Gulf of Mexico 2006: America’s Expanding Frontier, which is
its sixth report about deepwater exploration and activity in the Gulf of Mexico
(GOM). This report was first published
in 1997, at which time there were 17 producing projects in the deepwater
(greater than or equal to 1000 feet). Since then, the number of producing
projects has increased to 118 as of the end of March 2006, which is 37 percent
higher than in 2002. Deepwater
production started in 1979 and has become more active within the past few years
because of advancements in technology and improving economics. According to the
MMS, the Outer Continental Shelf (OCS) Deep Water Royalty Relief Act, which was
passed in 1995 and revised in 2000, motivated increased deepwater drilling
activity in the GOM. This act provided
economic incentives to encourage operators to develop leases in deep water
greater than 200 meters (656 feet). In 1992 there were only about 3 rigs
drilling in deep water, whereas in 2005 that increased to an average of 30 rigs
drilling in deep water. Natural gas production from deepwater projects
increased each year by an average of roughly 400 million cubic feet of gas per
day (MMcf/d) from 1997 through 2004 to more than 3,800 MMcf/d, despite a
production decline in 2004. Deepwater
leases in the GOM comprised roughly 54 percent of the active leases in the GOM
at the end of 2005.
Natural Gas Transportation Update: