
| xxxxx
|
| Home > Natural Gas > Natural Gas Weekly Update |
|
Overview:�
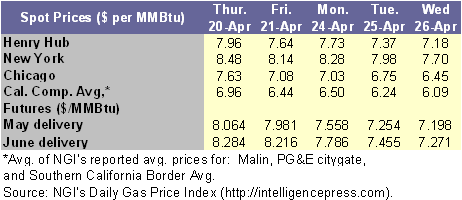
Thursday, April 27 (next release 2:00 p.m. on May 4, 2006) Since
Wednesday, April 19, natural gas spot prices decreased at virtually all market
locations in the Lower 48 States, with decreases exceeding $0.30 per MMBtu at
most markets.� On Wednesday, April 26, prices
at the Henry Hub averaged $7.18 per MMBtu, decreasing 54 cents per MMBtu, or about
7 percent, since the previous Wednesday.�
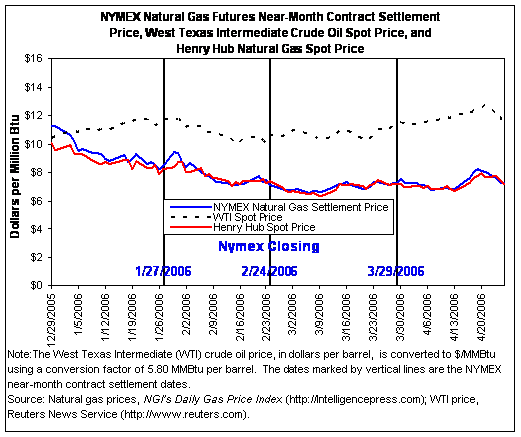
The NYMEX futures contract for May delivery at the Henry Hub settled at
$7.198 per MMBtu, on Wednesday, April 26, declining about 99 cents or 12 percent
since last Wednesday.� Natural gas in
storage was 1,851 Bcf as of April 21, which is about 62 percent above the
5-year average.� The spot price for West
Texas Intermediate (WTI) crude oil decreased 36 cents per barrel, or less than
1 percent, on the week (Wednesday-Wednesday) to $71.71 per barrel or $12.36 per
MMBtu. Spot prices decreased at virtually all market locations
since last Wednesday, April 19, falling by as much as 81 cents per MMBtu.� Moderate temperatures in most of the Lower 48
States and sufficient supplies of natural gas in storage likely contributed to
the price declines.� Overall, price
declines were widespread and did not seem to have a definitive geographical
pattern as decreases ranged between 30 and 60 cents per MMBtu, or about 4 to 9
percent, at the vast majority of market locations.� However, the largest price declines of more
than 70 cents per MMBtu occurred principally in the Midwest region with a
decline of 81 cents at the Midwest Alliance Pipeline market location. The
smallest decline since last Wednesday, April 19, occurred at the Florida
citygate market location, where prices fell 10 cents per MMBtu. Compared with
last year, prices are mixed.� West of the
Rockies, prices are 30 to 77 cents, or about 5 to 10 percent, below last year�s
levels at this time.� In contrast, prices
at most of the market locations east of the Rockies, including the producing States,
are about 10 to 30 cents per MMBtu, or about 2 to 5 percent, above last year�s
levels at this time.� The spot price at
the Florida citygate is about 75 cents per MMBtu or about 10 percent above its
level last year.
At
the NYMEX, the futures contract for May delivery at the Henry Hub expired
yesterday (April 26) at $7.198 per MMBtu, declining about 12 percent since Wednesday,
April 19. Similarly, prices for the other futures contracts through April 2007 decreased
between 3 and 14 percent, or about $0.29 to 1.14 per MMBtu during the same
period, with the price declines becoming progressively smaller in each
successive month. The 12-month futures strip (May 2006 through April 2007)
traded at a premium of $2.14 per MMBtu relative to the Henry Hub spot price, averaging
$9.32 per MMBtu as of Wednesday, April 26.�
The futures contract prices for the upcoming heating season months (November
2006 through March 2007) are about $4.05 per MMBtu higher than the Henry Hub
spot price on average.� Differentials of
this magnitude between the spot price and the futures contract prices provide
suppliers economic incentives to inject gas into storage. Since becoming the
near-month contract on March 30, 2006, the May contract declined about 29 cents
per MMBtu or about 4 percent. Recent Natural Gas Market Data
Working
gas in storage totaled 1,851 Bcf as of Friday, April
21, which is 62 percent above the 5-year average inventory level for the report
week, according to EIA�s Weekly Natural Gas Storage Report (See Storage Figure).
During the week, the implied net injection of 80 Bcf
was 37 percent more than the 5-year average of 58 Bcf
and 15 percent more than last year�s injection of 70 Bcf.
As of April 21, stocks exceeded last year�s level by 445 Bcf.
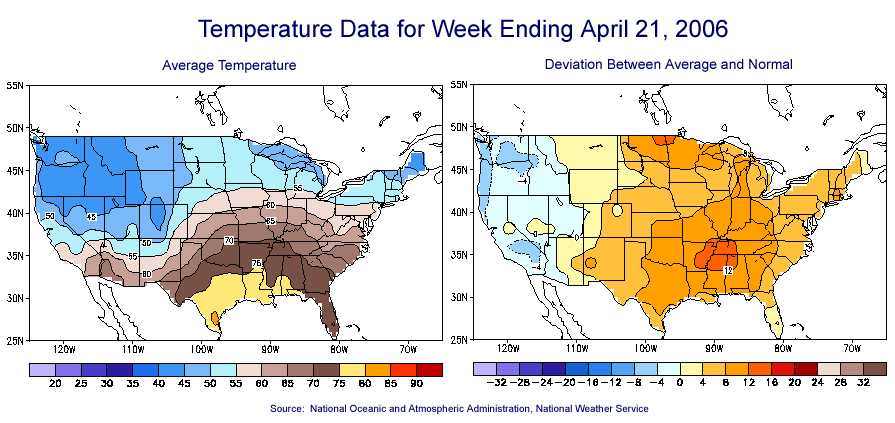
During the report week, moderate temperatures in the Lower 48 States likely
mitigated natural gas demand for heating and air conditioning and may have contributed
to the above-average net injections during the week.� Heating degree days were below normal in each
of the Census Divisions with the exception of the Pacific Census Division.� Cooling degree days were above normal on
average in the Lower 48 States, however demand for natural gas for air
conditioning load does not seem to be a significant factor at this point in the
injection season. (See Temperature Maps)
Other Market Trends: LNG Deliveries Slow in First Part of
2006: U.S. imports of liquefied
natural gas (LNG) this winter were well below year-ago levels, serving as a
reminder that stiff competition may develop in the global industry even with
high prices in the United States. In January and February 2006, the most recent
months for which data are available, LNG imports averaged 1.3 billion cubic
feet (Bcf) per day for a total of 78 Bcf, according to the Department of
Energy�s Office of Fossil Energy. This level is nearly 30 percent less than the
1.9 Bcf per day, or 111 Bcf overall, delivered during the first 2 months of
2005. In fact, total imports in February 2006 of 38.7 Bcf were the lowest
monthly level of imports since April 2003. While the world spot market for LNG
is growing, it is still a small part of total LNG trade and U.S. importers have
not yet begun bringing the expected large volumes of LNG to the United States
under long-term contracts. Volumes
available on the spot market in January and February were directed to Europe
and Asia, as buyers there proved willing to pay more than the market prices in
the United States. Trunkline LNG Company, located in Lake Charles, Louisiana, had
the lowest utilization of any U.S. regasification plant (not including the new
offshore Gulf Gateway facility), receiving just two cargos for a total of 6 Bcf.
This facility in the past has received the largest volumes of LNG from the spot
market. While five new LNG production facilities have come on-line recently in
the Atlantic Basin (where the United States receives the vast majority of its
LNG), LNG supplies continue to be tight as several of the facilities have
experienced longer-than-expected delays in moving to full utilization. For
example, the fourth train at the Atlantic LNG complex in Trinidad and Tobago
was officially declared operational on December 15, 2005, but experienced
start-up problems that delayed operating at full capacity. Despite
the decline in imports for the start of 2006, the Energy Information
Administration (EIA) this year forecasts a significant increase in deliveries
over the 631 Bcf delivered in 2005. In the April edition of the Short-Term Energy Outlook, EIA forecasts
imports of 770 Bcf, owing at least in part to the numerous liquefaction trains
that have come on-line in the Atlantic Basin since mid 2005. Unofficial data
from the Internet-based bulletin boards of LNG terminals suggest deliveries
have, in fact, increased in April. For example, Trunkline LNG�s sendout has
averaged almost 0.5 Bcf per day during the month. El Paso�s Southern LNG Inc.,
located on Elba Island, Georgia, has averaged 0.4 Bcf per day in send-out to
date in April. NOAA Reports Warmer-than-Normal Temperatures
for the First Quarter of 2006:� The National Oceanic and Atmospheric
Administration (NOAA) on April 17 released a report concerning temperature
trends for the winter period of early 2006.�
During the heating season months of early 2006 (January through March),
temperatures were the fifth warmest on record in the United States owing to a
record warm January, according to NOAA.�
More then half the Lower 48 States experienced much warmer-than-average
conditions.� The average temperature for
the contiguous United States for March was 44.0 degrees Fahrenheit,
which was 1.5 degrees warmer than the mean from 1895-2005. This also was warmer
than two-thirds of the March temperatures on record.� When temperatures are warmer, natural gas
heating demand decreases. As a result, natural gas prices generally have
declined since mid-December and relatively high volumes of working gas remained
in storage at the end of the winter. California on the other hand was
colder-than-average with several cities in California (e.g., Redding,
Sacramento, and San Francisco) reaching their coldest levels during March. Natural Gas Transportation Update:
| ||||||||||||||||||||||||||||||||||||||||||
| http://tonto.eia.doe.gov/oog/info/ngw/ngupdate.asp | ||||||||||||||||||||||||||||||||||||||||||
phone: 202-586-8800 email: infoctr@eia.doe.gov Specialized Services from NEIC |
||||||||||||||||||||||||||||||||||||||||||
|
phone: 202-586-8959 email: wmaster@eia.doe.gov |
||||||||||||||||||||||||||||||||||||||||||
|
|
||||||||||||||||||||||||||||||||||||||||||
|
|
||||||||||||||||||||||||||||||||||||||||||
|
|
||||||||||||||||||||||||||||||||||||||||||
| . | ||||||||||||||||||||||||||||||||||||||||||
| Renewables | Alternative Fuels | Prices | States | International | Country Analysis Briefs | ||||||||||||||||||||||||||||||||||||||||||
| Environment | Analyses | Forecasts | Processes | Sectors | ||||||||||||||||||||||||||||||||||||||||||