
| xxxxx
|
| Home > Natural Gas > Natural Gas Weekly Update |
|
Overview:�
Thursday, March 30 (next release 2:00 p.m. on April 6, 2006) Since
Wednesday, March 22, natural gas spot prices decreased at most market locations
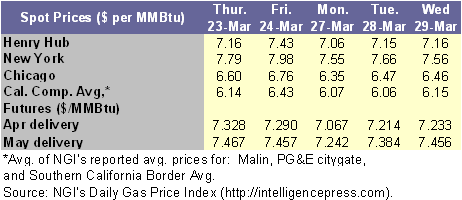
in the Lower 48 States, with declines of up to 38 cents per MMBtu.� On Wednesday, March 29, the spot price at the
Henry Hub averaged $7.16 per MMBtu, climbing about 9 cents per MMBtu or about 1
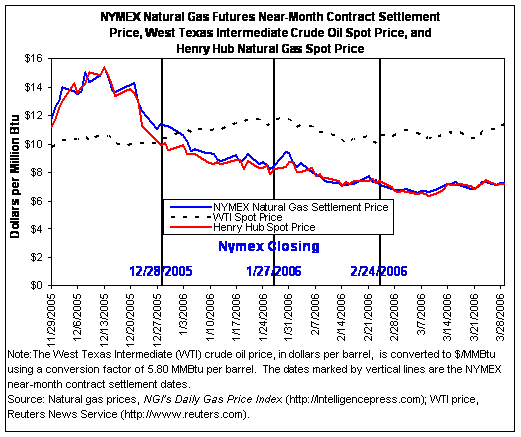
percent during the week (Wednesday�Wednesday).� The futures contract for April delivery at
the Henry Hub settled at $7.233 per MMBtu yesterday (March 29), gaining about 28
cents per MMBtu or about 4 percent since the previous Wednesday.� Natural gas in storage was 1,705 Bcf as of March
24, which is about 62 percent above the 5-year average.� Since March 22, the spot price for West Texas
Intermediate (WTI) crude oil increased $5.97 per barrel, or about 10 percent to
$66.00 per barrel or $11.379 per MMBtu. Natural gas prices decreased by less than 38 cents per
MMBtu at most market locations in the Lower 48 States as temperatures moderated
following the weekend.� At the same time,
some market locations managed to post gains of up to 24 cents or 2 percent
since last Wednesday, March 22.� Despite large
potential market supplies with storage over 62 percent above the 5-year
average, the general price level in the natural gas market has shown surprising
resilience over the past few weeks.� After
an extended price decline since mid December, spot prices reversed trend in
early March, but generally have been retreating since last Wednesday, March
22.� The spot price for natural gas at
the Henry Hub bottomed out at $6.31 per MMBtu on March 9, then increased to $7.43
on March 24 before declining to $7.16 yesterday (March 29).� The largest declines occurred in the
Northeast region, where prices at the Transcontinental Zone 6 delivery points serving
New York City and the Middle Atlantic States fell more than 30 cents.� Prices at selected market locations in the
Midcontinent, Rocky Mountains, Alabama, and West Texas regions also declined by
20-30 cents since last Wednesday.�
Meanwhile prices in California remained essentially unchanged on average
since last Wednesday, March 22.� Markets
posting gains since last Wednesday included the Houston Ship Channel, which
climbed nearly 4 percent or about 24 cents per MMBtu.� Most of the increases at other markets were
less than a dime.� At $7.16 per MMBtu, prices
at the Henry Hub as of Wednesday, March 29, were 22 cents, or about 3 percent above
last year�s level. ��
At
the NYMEX, the price of the futures contract for April delivery at the Henry
Hub expired at $7.233 per MMBtu yesterday (March 29), increasing about 28 cents
per MMBtu or about 4 percent since Wednesday, March 22, and about 44 cents per
MMBtu or nearly 7 percent since becoming the near-month contract on �February 27.�
The 12-month futures strip (April 2006 through March 2007) traded at a premium
of $1.76 per MMBtu relative to the Henry Hub spot price, averaging about $8.92 per
MMBtu as of Wednesday, March 29, with contracts ranging between $7.23 and $11.03
per MMBtu.� � Recent
Natural Gas Market Data
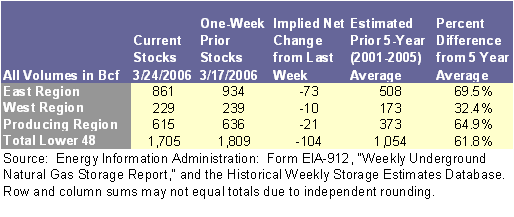
Working
gas in storage decreased to 1,705 Bcf as of Friday, March 24, 2006, according
to EIA�s Weekly Natural Gas Storage
Report (See
Storage Figure).�
Storage levels are 651 Bcf, or 62 percent, above the 5-year average, and
459 Bcf, or 37 percent, above the storage level at this time last year.� The implied net withdrawal of 104 Bcf was more
than three times as much as the 5-year average net withdrawal of 30 Bcf, and
nearly twice as much as last year�s net withdrawal of 56 Bcf.� This week�s net withdrawal is the third largest
of 2006.� Nevertheless, this is the first
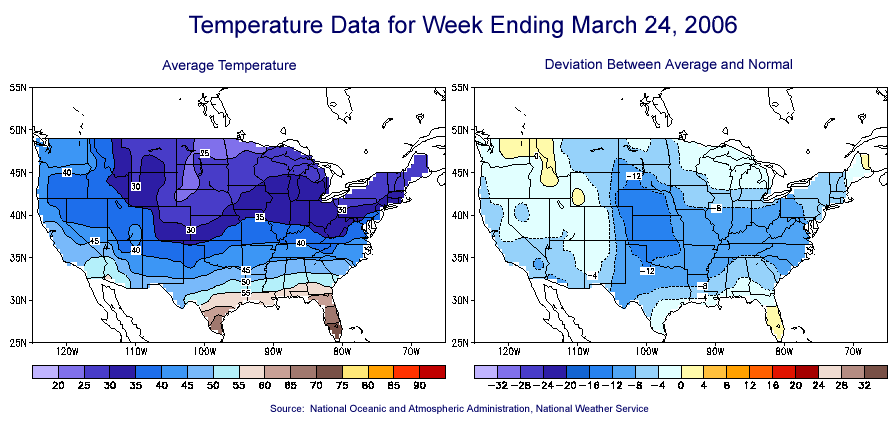
time in 4 weeks that the net withdrawal has exceeded the 5-year average.� The relatively large withdrawal likely
resulted from temperatures that were more than 18 percent colder-than-normal in
each of the nine Census Divisions in the Lower 48 States during the report week
(See
Temperature Maps).� Heating
degree days along the northern tier showed the smallest deviations from normal
as New England, the Middle Atlantic, and East and West North Central Divisions
experienced temperatures that were 18, 23, 23, and 24 percent
colder-than-normal, respectively, as measured by the National Weather Service
heating degree days for the week ending March 23, 2006.� Heating degree days in the East and West
South Central Divisions were about 44 and 48 percent, respectively, above
average.� Overall, heating degree days
were 26 percent above normal for the Lower 48 States.� Despite the relatively large net withdrawal,
only 1,489 Bcf has been withdrawn from storage since the beginning of the
heating season on November 1.� If
withdrawals from storage over the last week of the heating season match the
5-year average, then cumulative net withdrawals for the heating season will be
about 1,503 Bcf.�� This is about 26 percent
below the 5-year average withdrawal of 2,018 Bcf, and the smallest cumulative
seasonal withdrawal since the 1989-1990 heating season.��
Other Market Trends: Natural Gas Rig Count Near Record
Levels:� Rigs drilling for natural gas were 1,314 for
the week ending March 24, 2006, according to Baker-Hughes Incorporated.� Natural gas drilling rigs in the beginning of
February exceeded 1,300 for the first time ever, and they have remained above
1,300 with the exception of 2 weeks in mid-March.� The monthly averages for natural gas drilling
rigs for February and March exceeded 1,300 rigs, which is more than double the
monthly average for April 2002.� U.S.
total rigs drilling reached a record high of 1,571 for the week ending March
24, 2006, and have remained above 1,500 since the beginning of February.� Natural gas drilling made up 84 percent of
the total rigs drilling during the week. Natural Gas Transportation Update:
| ||||||||||||||||||||||||||||||||||||||||||
| http://tonto.eia.doe.gov/oog/info/ngw/ngupdate.asp | ||||||||||||||||||||||||||||||||||||||||||
phone: 202-586-8800 email: infoctr@eia.doe.gov Specialized Services from NEIC |
||||||||||||||||||||||||||||||||||||||||||
|
phone: 202-586-8959 email: wmaster@eia.doe.gov |
||||||||||||||||||||||||||||||||||||||||||
|
|
||||||||||||||||||||||||||||||||||||||||||
|
|
||||||||||||||||||||||||||||||||||||||||||
|
|
||||||||||||||||||||||||||||||||||||||||||
| . | ||||||||||||||||||||||||||||||||||||||||||
| Renewables | Alternative Fuels | Prices | States | International | Country Analysis Briefs | ||||||||||||||||||||||||||||||||||||||||||
| Environment | Analyses | Forecasts | Processes | Sectors | ||||||||||||||||||||||||||||||||||||||||||