
| xxxxx
|
| Home > Natural Gas > Natural Gas Weekly Update |
|
Overview:�
Thursday, October 7 (next release 2:00 p.m. on October 14) Natural
gas spot and futures prices generally moved in opposite directions for the week
(Wednesday to Wednesday, September 29-October 6), as spot prices fell at most
market locations, while futures prices continued to climb higher.� In yesterday�s (Wednesday, October 6) trading
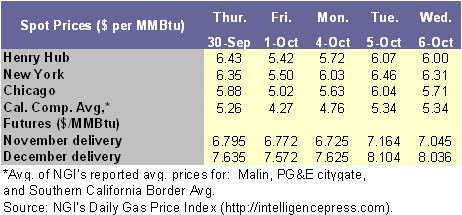
at the Henry Hub, the spot price for natural gas averaged $6.00 per MMBtu, down 23 cents per MMBtu,
or close to 4 percent, from the previous Wednesday.� On the New York Mercantile Exchange (NYMEX),
the futures contract for November delivery gained $0.134 per MMBtu on the week, or about 2 percent, as it settled
yesterday at $7.045.� Settlement prices
for contracts for gas delivery in December 2004 through March 2005 rose much
more sharply, with increases ranging from just over 40 cents to nearly 60 cents
per MMBtu.� EIA
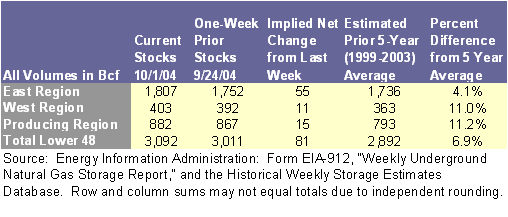
reported that inventories were 3,092 Bcf as of
Friday, October 1, which is 6.9 percent greater than the previous 5-year
average for the week.� The spot price for
West Texas Intermediate crude oil rose $2.45 per barrel (42 cents per MMBtu) on the week, or about 5 percent, to yesterday�s
record-high price of $51.98 per barrel ($8.96 per MMBtu).�� The upward price trend that closed out the previous
week (Wednesday to Wednesday, September 22-29) was abruptly reversed to begin
the past week.� Spot prices declined on
the week mostly in the range of a dime to 35 cents per MMBtu.� Significant price drops experienced in all
regional markets on Thursday (September 30) became more widespread and severe
on Friday, as prices fell that day by over $1 per MMBtu
at more than one-third of the reported price locations.� Cumulative two-day declines ranged from
nearly 70 cents to almost $2 per MMBtu, influenced by
mild weather and the impending drop in industrial load over the weekend, as
well as the easing of futures prices.�
Spot prices revived strongly on Monday and continued to rally on
Tuesday, as a modicum of heating load from a weak and short-lived cold front
was generated in parts of the Midwest and Midcontinent
beginning over the weekend.� The market
felt some additional upward price pressure from production shut-ins that
lingered into a third week (see Other
Market Trends below), as well as from rising crude oil prices.� Prices fell again yesterday (Wednesday,
October 6) as a warming trend began in the eastern half of the nation.� For the week, the spot price for Florida Gas Zone
2 showed the largest drop in the nation, at $1.07 per MMBtu,
reflecting in part the loss of demand from extensive power outages in Florida
wrought by Ivan.� Weekly price declines
in the consuming regions of the Northeast and Midwest averaged 23 and 35 cents,
respectively.� Rising heat in the desert
Southwest prompted weekly price increases of under a dime at just three pricing
locations that serve southern California.���
A one-day increase in the price of the near-month
futures contract (for November delivery) on the NYMEX overshadowed four trading
days of moderate losses, pushing the November contract up by $0.134 per MMBtu, or just under 2 percent, over its level of the
previous Wednesday (September 29), as it settled yesterday at $7.045.� The high for the past week occurred on
Tuesday (October 5) when prices increased $0.439 per MMBtu
to $7.164 per MMBtu, coinciding with the November
crude oil futures contract�s jump of $1.18 per barrel to a (then) record high
settlement price of $51.09 per barrel.�
The November contract thus became the first near-month contract to settle
above $7 on consecutive days since natural gas futures trading began in
1990.� Price patterns for contracts for
the balance of the heating season (December 2004-April 2005) differed from
November, rising on three of five trading days and settling two days in a row
above $8 per MMBtu.�
Concerns about market prices or supplies in the coming winter kept the
differential between the price for gas for delivery in December-March and the
Henry Hub spot price over $2 per MMBtu.� This continues to provide significant economic
incentive to inject gas into storage, even as storage levels continue to be
quite high historically. Recent Natural Gas
Market Data
Natural
gas stocks stood at 3,092 Bcf as of Friday, October
1, according to EIA�s Weekly Natural Gas Storage Report.�
The implied net injection for the week of 81 Bcf
exceeded the previous 5-year (1999-2003) average by nearly 27 percent, leaving
inventories 188 Bcf larger than at this point last
year, and 200 Bcf more than the previous 5-year average (See
Storage Figure).� Although the rate of net injections declined
during late September, net additions to storage during September were an
estimated 340 Bcf, which compares favorably with the
prior 5-year average for the month (according to EIA�s
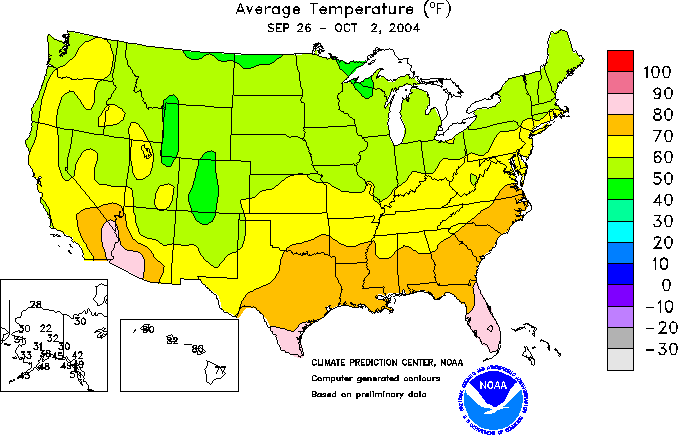
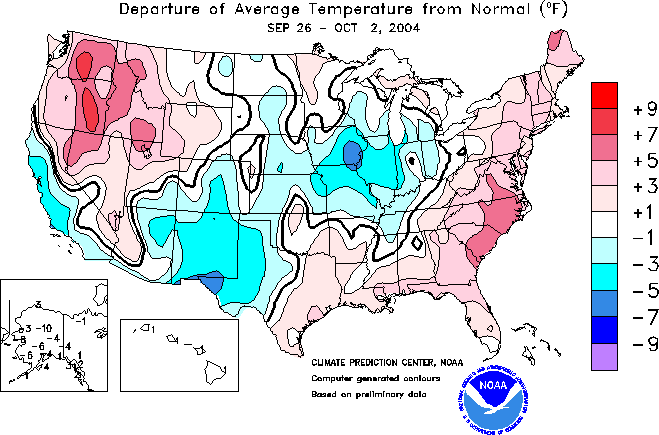
monthly storage data series) of 331 Bcf.� Generally mild temperatures throughout the
nation (See Temperature Map) resulted in little demand for space heating or
cooling, allowing significant injections despite the second full week of
production shut-ins in the Gulf of Mexico as a result of Hurricane Ivan (see Other Market Trends, below for further
details).� Although some regions of the
country experienced higher-than-normal heating- or cooling-degree days (See Deviations Map),
cooling degree days were less than 10 percent greater than normal for the
nation as a whole, and heating degree days were more than 39 percent below
normal.� For the most part, mild
temperatures have prevailed throughout the summer and thus far in the fall,
facilitating a strong stock build right through September.�
Other
Market Trends: EIA
Releases October Winter Fuels Outlook: 2004-2005: The Energy Information Administration (EIA) has
published its Winter
Fuels Outlook: 2004-2005, which summarizes the likely demand,
supply, and prices for natural gas, heating oil, propane, and electricity
during the upcoming winter (October 2004 � March 2005). According to the
report, average residential natural gas prices are expected to be 11 percent
higher than they were last winter, and household expenditures are expected to
be 15 percent higher. Natural gas prices weakened in August as cooling demand
levels remained well below normal. However, natural gas prices (spot and
futures) increased in the second half of September owing at least in part to
the natural gas production losses in the Gulf of Mexico caused by Hurricane
Ivan. The reduction in natural gas production resulting from the hurricanes in
September lowered the storage injection rate in the latter half of the month;
however stocks remain well above the 5-year average.� With ongoing high levels of natural gas wells
drilled in North America, 2005 domestic production is projected to grow by 1.4
percent. Steady increases in liquefied natural gas imports and limited export
growth are expected to contribute to moderate improvement in the supply picture
through 2005. MMS Releases a Fact Book on Current OCS
Infrastructure in the Gulf of Mexico.� The Minerals Management Service (MMS)
released on September 27th a report on oil and gas-related
infrastructure and how it supports offshore activities.� The OCS-Related
Infrastructure in the Gulf of Mexico Fact Book (OCS Study MMS 2004-027) includes data collected in 2000 and
2001 and examines historic information for past and future trends in the
construction, use, and retirement of infrastructure related to operations on
the Outer Continental Shelf (OCS).� For
over 100 years, oil and gas exploration and production have occurred in the
states that border the Gulf of Mexico, and for the past 50 years offshore
activity has occurred in coastal waters and on the OCS.�� During this time many facilities have been
developed to support offshore production.�
In this study 11 major infrastructure categories are identified and
described, such as platform fabrication yards, port facilities, shipyards and
ship building yards, pipelines, natural gas processing facilities, natural gas
storage facilities, refineries, and petrochemical facilities. The fact book
discusses each of these infrastructure areas and its relationship to offshore
oil and gas activities. Update on Impacts of Hurricane Ivan: As of October 6, the U.S. Minerals Management
Service (MMS) reported that 1.8 billion cubic feet per day of natural gas and
478 thousand barrels per day of oil production in the Federal offshore areas of
the Gulf of Mexico remain shut in. The current level of shut-ins is well below
the peak of 6.5 billion cubic feet per day of gas and 1.3 million barrels per
day of oil. The current amount of shut-in gas and oil production is equivalent
to 14 percent and 28 percent of daily Federal offshore Gulf production,
respectively. The cumulative (9/13/04-10/06/04) shut-in gas production is
estimated at 70.5 billion cubic feet, while the cumulative shut-in oil
production is estimated at about 16 million barrels. MMS reported that a total
of 9 platforms and 2 rigs were still evacuated as of October 6, which is down
significantly from the high of 545 platforms. Shut-in production rates do not
include production lost due to the destroyed platforms, which recently has been
estimated by MMS to be 9 million cubic feet per day. Summary: Spot prices displayed significant daily variability
on their way to an overall decline for the week, as a general lack of
weather-related demand and relatively high inventories offset the influence of
production shut-ins and price increases in the crude oil market.� Conversely, natural gas futures prices
increased significantly for the third week in a row.� Despite a slight slowing of the stock build
for several weeks in September, the month ended with a week of
higher-than-average implied net injections, closing out with cumulative storage
additions for the month that exceeded the previous 5-year average. | ||||||||||||||||||||||||||||||||||||||||||
| http://tonto.eia.doe.gov/oog/info/ngw/ngupdate.asp | ||||||||||||||||||||||||||||||||||||||||||
phone: 202-586-8800 email: infoctr@eia.doe.gov Specialized Services from NEIC |
||||||||||||||||||||||||||||||||||||||||||
|
phone: 202-586-8959 email: wmaster@eia.doe.gov |
||||||||||||||||||||||||||||||||||||||||||
|
|
||||||||||||||||||||||||||||||||||||||||||
|
|
||||||||||||||||||||||||||||||||||||||||||
|
|
||||||||||||||||||||||||||||||||||||||||||
| . | ||||||||||||||||||||||||||||||||||||||||||
| Renewables | Alternative Fuels | Prices | States | International | Country Analysis Briefs | ||||||||||||||||||||||||||||||||||||||||||
| Environment | Analyses | Forecasts | Processes | Sectors | ||||||||||||||||||||||||||||||||||||||||||