
| xxxxx
|
| Home > Natural Gas > Natural Gas Weekly Update |
|
Overview:�
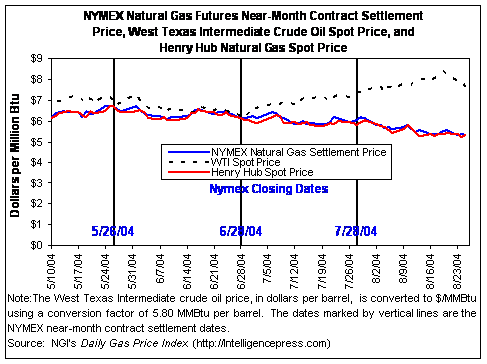
Thursday, August 26 (next release 2:00 p.m. on September 2) Natural gas prices in both the spot and futures markets
continued their downward slide, as unusually cool August temperatures persisted
for another week in most areas of the country.�
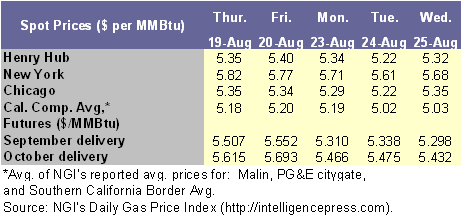
At the Henry Hub, the spot price edged down 3 cents on the week
(Wednesday to Wednesday, August 18-25) as spot gas traded yesterday (August 25)
for $5.32 per MMBtu.� On the New York
Mercantile Exchange (NYMEX), the futures contract for September delivery
declined over 8 cents, or just under 2 percent, settling yesterday at $5.298
per MMBtu.� EIA reported that inventories
were 2,614 Bcf as of Friday, August 20, which is 6.7 percent greater than the
prior 5-year average.� After climbing to
consecutive record highs on Wednesday and Thursday of last week (August 18-19),
the spot price for West Texas Intermediate (WTI) crude oil fell sharply in the
ensuing 4 trading days.� The WTI spot
price declined $3.53 per barrel ($0.61 per MMBtu) on the week to $43.83 ($7.56),
a drop of over 7 percent. Spot prices fell for a fifth straight week as mild
August weather continued in most major gas-consuming areas of the nation.� Temperatures that hovered in the 70s and low
80s for most of the week in major Midwest and East Coast markets limited demand
for air conditioning load.� Spot prices
in consuming markets east of the Rockies, and supply areas serving those
markets, fell mostly around a nickel or a few cents more on the week.� Declines at Northeast locations were a bit
higher, ranging from 9 to 13 cents per MMBtu.�
The TRANSCO Zone 6 New York citygate price ended the week down 18 cents
at $5.68 per MMBtu.� In California, faltering
swing demand prompted a high-linepack operational flow order on the PG&E
system for Wednesday (August 25).�
Throughout the West spot price declines were quite a bit larger.� The average price declines for all locations
in the Rockies and in California were 23 and 24 cents per MMBtu, respectively,
or nearly 5 percent in both regions.� On
Wednesday and Thursday, prices at Malin, OR, and PG&E�s southern border, as
well as the Southern California Border Average price, fell below $5 per MMBtu
for the first time since March 2004.�
Even the fire and damage at one of the salt caverns in Duke Energy�s
Moss Bluff storage facility seemed to have little effect on cash prices. ��
On the NYMEX, settlement prices for the futures
contracts for delivery in September and October declined for a fourth straight
week.� The near-month contract (for
September delivery) dropped $0.084 per MMBtu to settle yesterday at $5.298�the
lowest settlement price for the prompt month since the March 2004 contract
closed trading on February 25 at $5.150.�
Since becoming the near-month contract on July 29, the September contract
has lost $0.882 per MMBtu, or just over 14 percent in value.� While futures prices for the next two months
reflect the expectation of a diminishing likelihood of significant swing demand
this late in the summer as well as the continuing strong inventory situation,
prices for delivery in the next heating season increased slightly on the week,
ranging from nearly 2 to nearly 5 cents per MMBtu.� Further, the price spread between the futures
prices for delivery in the months of December through March and the Henry Hub
spot price grew to unusually large levels during the week (for example, the
settlement price for the January 2005 contract on Tuesday, August 24, was
$1.754 higher than the Henry Hub spot price), providing a strong incentive for
continued robust storage injections, and also signaling the market�s current
expectations about the coming winter. Recent Natural Gas
Market Data
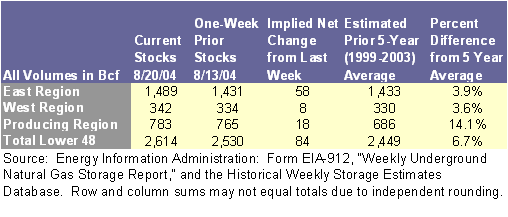
Working
gas inventories stood at 2,614 Bcf as of Friday, August 20, owing to net
additions to storage of 84 Bcf, according to EIA�s Weekly Natural Gas Storage Report of Thursday, August 26. (See Storage Figure). �This estimate of inventories reflects a
downward adjustment of 6 Bcf to account for the incident at the Moss Bluff
storage facility in Texas.� Even with the
adjustment, the implied net change in working gas volumes for the report week was
over 50 percent greater than the 5-year average.� Inventory levels as of August 20 were 6.7
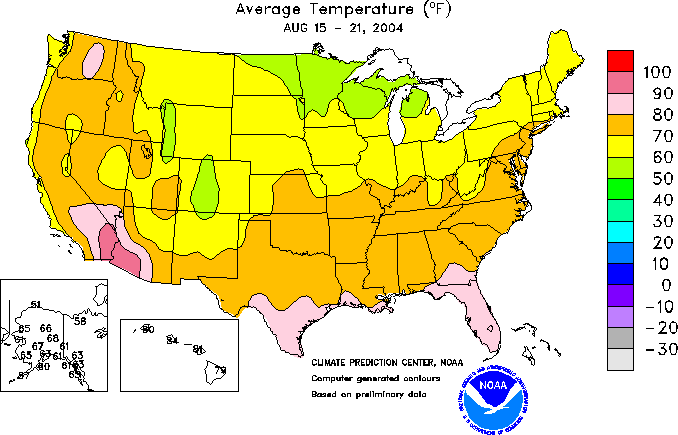
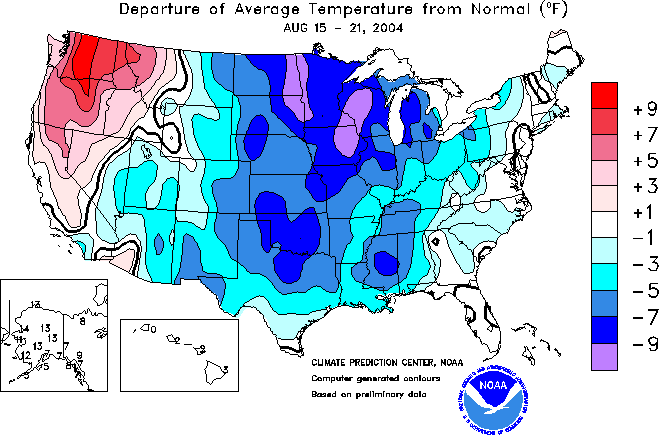
percent higher than the prior 5-year (1999-2003) average for the week.� Continuing unusually cool temperatures for
virtually the entire nation east of the Rocky Mountains suppressed swing demand
for electricity generation for space cooling, allowing more supply to flow into
storage (See Temperature Map)
(See Deviations Map).
�According to the latest data from
the National Weather Service, eight of the nine Census Divisions in the Lower
48 States experienced fewer cooling degree days (CDDs) than normal for the week
ended Saturday, August 21, and most by significant amounts.��� Temperatures for the nation as a whole were
nearly 22 percent cooler than normal, as measured by CDDs.� The West South Central division, containing
Arkansas, Louisiana, Oklahoma, and Texas and normally generating significant
air conditioning load, was 26.1 percent cooler than normal.�
Other
Market Trends: MMS Modifies Exploration Periods for
Ultra-Deep Prospects: The Minerals Management Service (MMS) has
issued a new notice to lessees and operators (NTL) which extends the period MMS
was using to grant suspensions of operations for exploration beneath salt
sheets at ultra-deep depths (greater than 25,000 feet). A suspension, which
extends the term of the lease, is needed at times to allow additional time for
geophysical evaluations to identify a good target for drilling.� In order to be eligible for such an NTL, the
following conditions must be met:� the
lease must be in its primary term on or before August 1, 2002; the potential
target must entail drilling below 25,000 feet true vertical depth subsea; the
operator of the lease must have acquired and interpreted 3-D geophysical data
beneath the salt sheet and over the entire lease area before the end of the
fifth year of the primary term; and the operator must submit a practical
schedule of work leading to the start of drilling.� MMS sees that this NTL is in the national
interest to expedite the exploration for new sources of hydrocarbons at these
ultra-deep depths. EIA
Enhances Energy Kids� Page: The
Energy Information Administration has improved the popular Energy Kid's Page
section of its Web site (http://www.eia.doe.gov/kids). Changes include expanded
and updated content, a redesigned format, a section on energy vocabulary terms
(Energy Slang), and a new search engine. The improvements were designed to make
the site more valuable for teachers and more enjoyable and rewarding for
students. The site includes energy facts on different
sources of energy, its uses, and the science of energy. Additionally, it
presents an interactive way for children to learn about energy through quizzes,
puzzles, and other fun and game features. It also offers an insight into the
history of energy as well as brief biographies of individuals who have made
significant contributions to energy and science. Summary: Spot prices moved lower for the fifth consecutive
week as cooler-than-normal temperatures continued throughout most of the
nation.� Futures prices for gas delivery
through October fell for the fourth consecutive week as the chance of
significant temperature-driven swing demand declines and inventories continue
to build at a greater-than-average pace.�
Futures prices for delivery in the coming heating season increased
slightly and carry a significant premium over current cash prices.� ��� | ||||||||||||||||||||||||||||||||||||||||||
| http://tonto.eia.doe.gov/oog/info/ngw/ngupdate.asp | ||||||||||||||||||||||||||||||||||||||||||
phone: 202-586-8800 email: infoctr@eia.doe.gov Specialized Services from NEIC |
||||||||||||||||||||||||||||||||||||||||||
|
phone: 202-586-8959 email: wmaster@eia.doe.gov |
||||||||||||||||||||||||||||||||||||||||||
|
|
||||||||||||||||||||||||||||||||||||||||||
|
|
||||||||||||||||||||||||||||||||||||||||||
|
|
||||||||||||||||||||||||||||||||||||||||||
| . | ||||||||||||||||||||||||||||||||||||||||||
| Renewables | Alternative Fuels | Prices | States | International | Country Analysis Briefs | ||||||||||||||||||||||||||||||||||||||||||
| Environment | Analyses | Forecasts | Processes | Sectors | ||||||||||||||||||||||||||||||||||||||||||