
| xxxxx
|
| Home > Natural Gas > Natural Gas Weekly Update |
|
Overview:�
Thursday, July 22 (next release 2:00 p.m. on July 29) Since
Wednesday, July 14, natural gas spot prices have increased at virtually all
market locations in the Lower 48 States.�
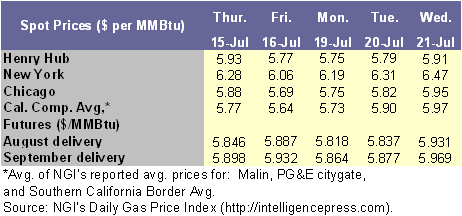
For the week (Wednesday-Wednesday), prices at the Henry Hub remained at
$5.91 per MMBtu.�
Yesterday (July 21), the price of the NYMEX futures contract for August
delivery at the Henry Hub settled at $5.931 per MMBtu,
decreasing roughly 5 cents or less than 1 percent since last Wednesday (July
14).� Natural gas in storage was at 2,227
Bcf as of July 16, which is 2.6 percent above the
5-year average.� The spot price for West
Texas Intermediate (WTI) crude oil fell 35 cents per barrel or less than 1
percent on the week to $40.63 per barrel or $7.005 per MMBtu. Strengthening weather fundamentals and increasing power
generation loads since Monday, July 19, contributed to rebounding gas prices at
most market locations in the Lower 48 States.�
The growing potential for a supply-side disturbance also contributed to
rising prices on Wednesday, July 21, as the first tropical depression of the
Atlantic hurricane season may be gathering south of Hispaniola.� The largest gains in spot prices since last Wednesday,
July 14, principally occurred west of the Rockies as increases in the
California and Rocky Mountains regions averaged 21 and 19 cents per MMBtu, respectively.�
Prices in the Northeast gained 11 cents per MMBtu
on average with prices at the Algonquin and New York City citygates
climbing 19 and 17 cents per MMBtu,
respectively.� Gains elsewhere were less
pronounced with prices in the Midcontinent, Midwest,
and Texas regions increasing less than a dime on average.�� In contrast to the general pattern of rising
prices in the Lower 48 States, prices in Florida fell on average 8 cents per MMBtu.� Prices
continue to exceed last year�s levels by almost a dollar.� As of July 21, 2004, prices at the Henry Hub
are 90 cents or 17 percent above last year�s level.
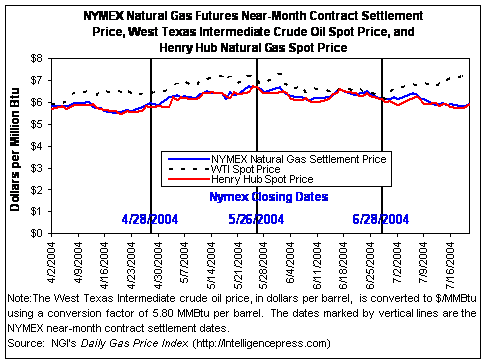
At
the NYMEX, the price of the futures contract for August delivery at the Henry
Hub decreased about 5 cents per MMBtu or nearly 1
percent since last Wednesday to $5.931 per MMBtu.� Similarly, the prices of the futures
contracts for delivery in each of the remaining 5 months of 2004 fell less than
a nickel from last Wednesday�s levels.�
Since falling below the $6.00 per MMBtu mark
on July 12, the August contract has varied in a range of about $5.82 to $5.98
per MMBtu.�
Futures contract prices for each month through the remaining months of
2004 and January 2005 exceed the Henry Hub spot price by 2 to 91 cents per MMBtu with each successive month larger than the preceding
month.� The January 2005 contract traded
at a 91-cent premium to the Henry Hub spot price yesterday (July 21).� With the futures strip through next winter
trading at a significant premium to the Henry Hub spot price, economic
incentives to inject gas into storage remain significant.�� However, the tightening of the basis
differential of the August and September contracts at 2 and 6 cents,
respectively, may reflect expected increasing cooling demand for natural gas,
which likely will compete with injection demand for natural gas during the
warmest days of summer.�� . Recent Natural Gas
Market Data
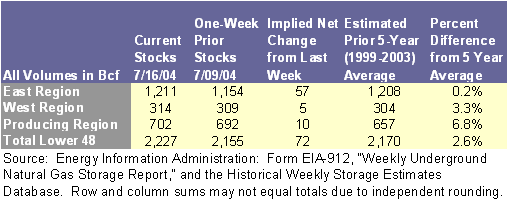
Working
gas in storage was 2,227 Bcf as of Friday, July 16,
2004, according to the EIA Weekly Natural Gas Storage Report.� This is 57 Bcf, or
about 2.6 percent, above the 5-year average for the report week. (See Storage Figure)� The implied net injection during the
report week was 72 Bcf, which is about 4 percent
above the 5-year average net addition of 69 Bcf for
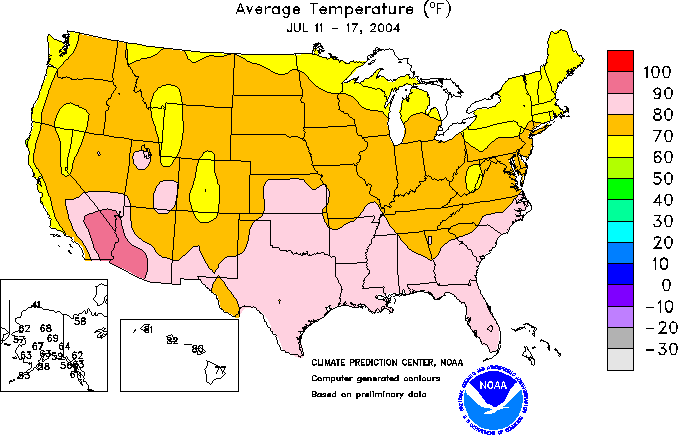
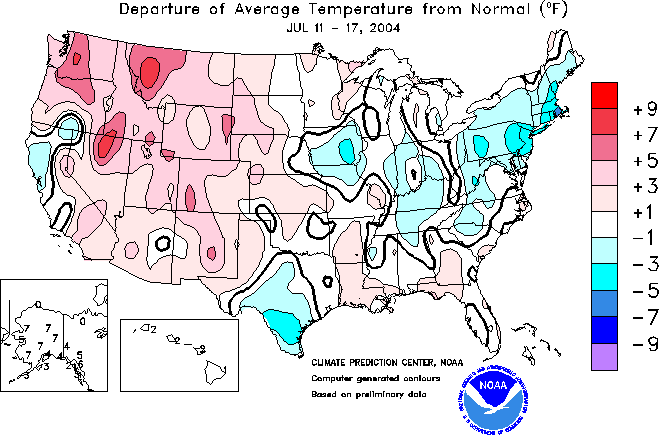
the week and 5 Bcf below the injection of 77 Bcf reported for the same week last year.� Cooling degree days were about 23 percent
below normal on average in the Lower 48 States during the week ended July 17.� The relatively mild temperatures east of the
Rockies likely contributed to the above-average injections. (See Temperature Map)
(See Deviations Map) �
Other
Market Trends: Final Lease Sale 192 in the Western
Planning Area:� The
Minerals Management (MMS) published a Federal Resister notice concerning Lease
Sale 192 for offshore oil and gas in the Western Planning Area of the Gulf of Mexico.� According to the MMS, it is possible that
this sale will increase annual oil production by 126 millions barrels from its
previous 136 million barrels and increase natural gas by 0.63 trillion cubic
feet from its previous 0.81 trillion cubic feet.� The sale area surrounds 3,907 blocks on 21.2
million acres of Federal land, which is located about 9 to 210 miles offshore
Texas and Louisiana and in water depths of 4 to more than 3,425 meters (13 to 11,303
feet).� The final notice includes changes
that were not included in the proposed notice published in March 2004.�� These changes include changes to the new
deepwater royalty suspension provisions and an increase in the bonus bid of
$12.50 from $25 for tracts in water depths of 400-799 meters. LNG
Second-Quarter Imports: U.S.
liquefied natural gas (LNG) imports rose by 26 percent in the second quarter
compared to the same period last year, according to Natural Gas Week.
Second-quarter imports increased by 6 percent compared to the first quarter, as
disruptions in supply from Trinidad and Tobago were more than offset by
increased imports from Algeria, Nigeria, Qatar, and Oman.� The Trinidad and Tobago outages affected the
Everett, Massachusetts, LNG facility the most, as the inflow decreased by about
6 Bcf for the quarter. Imports at the Lake Charles,
Louisiana, LNG terminal increased almost 28 percent compared to the first
quarter of 2004, however, it was still below its peak
capacity of 1 Bcf/d. The Cove Point, Maryland
terminal remained the largest LNG importer in the United States as imports
remained stable between the first and second quarters of 2004.� The decrease in Lake Charles� imports
relative to the same period last year is partly a result of the shift in
cargoes from Trinidad and Tobago to Elba Island, Georgia. Summary: Spot
prices rebounded with increases at most market locations outside of Louisiana,
Florida, and South Texas.� Prices for the
near-term NYMEX futures contract decreased less than 1 percent from last week�s
level.� Working gas in storage increased
to 2,227 Bcf, which is nearly 3 percent above the
5-year average.�� Natural
Gas Summary from the Short-Term Energy Outlook | ||||||||||||||||||||||||||||||||||||||||||
| http://tonto.eia.doe.gov/oog/info/ngw/ngupdate.asp | ||||||||||||||||||||||||||||||||||||||||||
phone: 202-586-8800 email: infoctr@eia.doe.gov Specialized Services from NEIC |
||||||||||||||||||||||||||||||||||||||||||
|
phone: 202-586-8959 email: wmaster@eia.doe.gov |
||||||||||||||||||||||||||||||||||||||||||
|
|
||||||||||||||||||||||||||||||||||||||||||
|
|
||||||||||||||||||||||||||||||||||||||||||
|
|
||||||||||||||||||||||||||||||||||||||||||
| . | ||||||||||||||||||||||||||||||||||||||||||
| Renewables | Alternative Fuels | Prices | States | International | Country Analysis Briefs | ||||||||||||||||||||||||||||||||||||||||||
| Environment | Analyses | Forecasts | Processes | Sectors | ||||||||||||||||||||||||||||||||||||||||||