
Overview:
Thursday, July 8 (next release 2:00 p.m. on July 15)
Natural
gas spot prices climbed 15 to 62 cents per MMBtu across the Lower 48 States
this week (Wednesday, June 30-Wednesday, July 7). Increases were highest in the
sun-drenched Southwest and California, but also significant in the Northeast
and Midwest. At the Henry Hub, the spot price increased 23 cents or roughly 4
percent to $6.28 per MMBtu. The price of the NYMEX futures contract for August
delivery at the Henry Hub similarly increased, gaining 21.5 cents per MMBtu
since last Wednesday to settle at $6.370 per MMBtu yesterday (July 7). Natural
gas in storage increased to 2,047 Bcf as of Friday, July 2, which is about 1.2
percent above the 5-year average inventory level for the report week. The spot
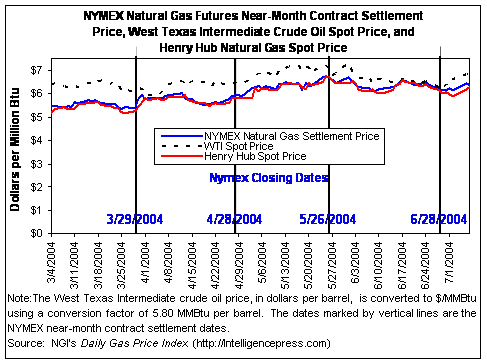
price for West Texas Intermediate (WTI) crude oil increased $2.26 per barrel,
or 6.1 percent, since last Wednesday to trade yesterday at $39.18 per barrel,
or $6.76 per MMBtu.
Higher prices for crude oil lifted prices for all
energy products this week, as all spot markets for natural gas registered
significant gains even with likely reduced industrial load during the Fourth of
July weekend. After drifting lower in previous trading sessions, spot prices
rose sharply on Tuesday as traders returned from the holiday weekend to news of
crude oil supply disruptions in Nigeria and Iraq. The Henry Hub spot price
increased 28 cents per MMBtu on Tuesday and gained an additional 12 cents
yesterday for a net increase of 23 cents on the week. Weekly gains were largest
in California and the Southwest, including West Texas, where temperatures
reached above 100 degrees for much of the week. At the Southern California
border, the spot price averaged $5.89 per MMBtu yesterday, an increase of 47
cents per MMBtu on the week. Prices in the region yesterday rose in part owing
to a fire at an electrical substation in Arizona that required additional
gas-fired units to come online to make up for the lost electric generation.
Significant price gains generally between 30 to 40 cents per MMBtu were
reported this week in the Midwest and the Northeast as temperatures increased
in the two regions, although they remain below normal. The price for delivery
off Tennessee Gas Pipeline in New England gained 35 cents per MMBtu to trade at
$6.71 yesterday.
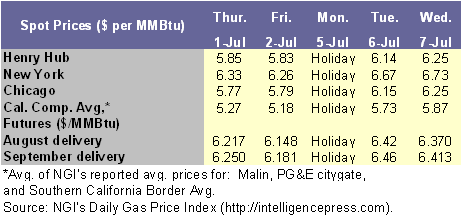
At the NYMEX, the price of the futures contract for
August delivery at the Henry Hub climbed about 22 cents per MMBtu since
Wednesday, June 30, to a close of $6.370 per MMBtu on Wednesday, July 7. As was
the case with spot prices, the near-month contract price appeared to receive a
lift from higher crude oil prices on Tuesday, increasing nearly 28 cents per
MMBtu during the day’s trading session. The current basis differential between
the Henry Hub spot price and those of the futures contracts for delivery in
each month through January 2005 increases for each successive month to a
maximum of almost 76 cents, providing suppliers an incentive to inject gas into
storage. The 12-month strip, or the average price for contracts over the next
year, closed yesterday at just under $6.479, a gain of just under 20 cents on
the week.
Recent Natural Gas
Market Data
|
Estimated Average Wellhead Prices |
||||||
|
|
Nov-03 |
Dec-03 |
Jan-04 |
Feb-04 |
Mar-04 |
Apr-04 |
|
Price ($ per Mcf) |
4.34 |
5.08 |
5.53 |
5.15 |
4.97 |
5.20 |
|
Price ($ per MMBtu) |
4.22 |
4.94 |
5.38 |
5.01 |
4.83 |
5.06 |
|
Note: The price
data in this table are a pre-release of the average wellhead price that will
be published in forthcoming issues of the Natural Gas Monthly. Prices were converted from $ per Mcf to $
per MMBtu using an average heat content of 1,027 Btu per cubic foot as
published in Table A4 of the Annual
Energy Review 2002. |
||||||
|
Source:
Energy Information Administration, Office of Oil and Gas. |
||||||
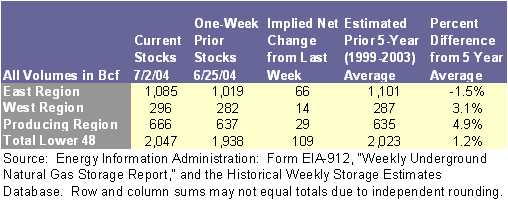
Working
gas in underground storage was 2,047 Bcf as of July 2, which is 1.2 percent
above the 5-year average inventory level for the report week, according to
EIA’s Weekly Natural Gas Storage Report. (See
Storage Figure) The implied net change of
109 Bcf for the report week was considerably higher than the 5-year average of
96 Bcf. Estimated inventories were 24 Bcf above the 5-year average of 2,023 Bcf
and 238 Bcf higher than last year’s stock level of 1,809 Bcf. The relatively
robust injection occurred during a week in which moderate temperatures likely
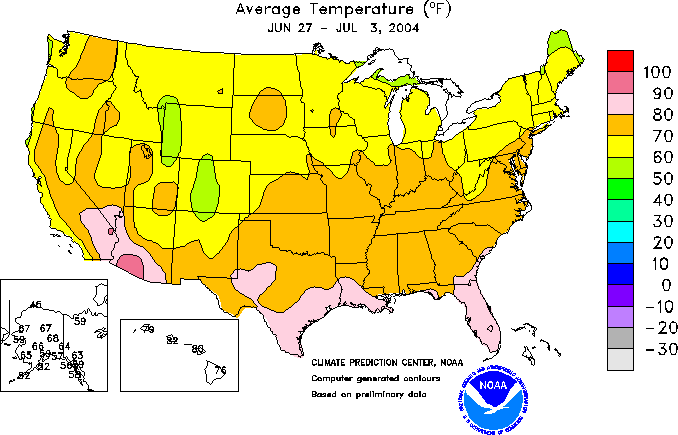
limited air-conditioning demand in many regions of the country. Key markets for
cooling demand had temperatures that were considerably lower than normal. The
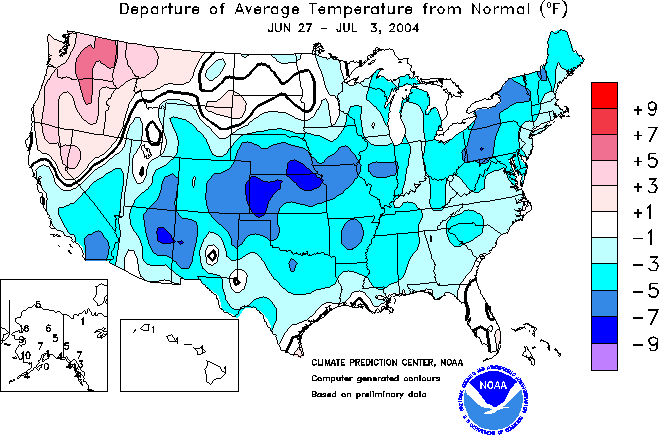
weather for the country as a whole, as measured by cooling degree days (CDDs),
was about 15.6 percent cooler than normal for the week ending July 3, according
to the National Weather Service (See
Temperature Map) (See Deviations Map).
Other
Market Trends:
GTI Files Application for a Collaborative RD&D
Program: On July 1, the Gas Technology Institute (GTI)
filed an application with the Federal Energy Regulatory Commission (FERC),
requesting approval of a collaborative gas industry research, development, and
demonstration (RD&D) program and associated budget for 2005. The 2005
program would be part of a broader 5-year (2005-2009) collaborative RD&D
plan and consist of 48 potential projects, which were developed with extensive
input from gas-industry organizations and other interested stakeholders. The
application proposes a $44 million funding level for RD&D in four related
areas of interest: gas supply ($7 million), gas transmission ($11 million), gas
distribution ($19 million), and gas utilization ($7 million) as well as $4
million for program management and administration. Funding would be generated
through a FERC-authorized commodity surcharge of 0.56 cents per dekatherm,
which would amount to an average charge of 50 cents per year for an average
American household according to GTI.
Shell Breaks Water Depth Record:
Shell Exploration and Production Company (SEPCo) announced that on June 23 it
began producing natural gas from its Coulomb development, which consists of the
two deepest water-depth wells in the world. The Coulomb C-2 became the world’s
deepest water-depth completion on May 2, when it was completed at a depth of
7,565 feet. However, the record was broken 17 days later, when C-3 was
completed in 7,570 feet of water. The wells are located in Mississippi Canyon
blocks 657 and 613 in the deepwater Gulf of Mexico and are tied back via a
27-mile pipeline to the BP-Shell Na Kika Floating Development System in Mississippi
Canyon 474. The C-2 well is currently producing about 65 million cubic feet of
gas per day as flow ramps up. Both it
and the C-3 well are capable of producing 100 million cubic feet of gas per
day. SEPCo has a 100 percent interest in the C-2 well and Petrobras America
Inc. is a one-third partner in the C-3 well.
Natural Gas
Summary from the Short-Term Energy Outlook:
The Energy
Information Administration (EIA) projects that natural gas prices will remain
high through the rest of 2004 (Short-Term Energy Outlook, July
2004). Wellhead prices are expected to average $5.85
per MMBtu from July through December, while composite spot prices will likely
stay well above $6.00. Spot prices at the Henry Hub averaged $6.34 per MMBtu in
May and $6.27 in June, as strong demand for natural gas coupled with high
petroleum prices has led to higher gas prices despite nearly normal storage
inventory levels. Storage stocks at the end of June, based on monthly data,
were almost 3 percent higher than the 5-year average and 14 percent higher than
last year at the same time. Overall in 2004, spot prices at the Henry Hub
likely will average about $6.12 per MMBtu, which is 9 percent higher than the
2003 average. In 2005, prices are expected to decrease only slightly as
production gains are expected to be relatively low.
Natural
gas production is expected to increase by only about 0.5 percent in 2004 and
2005. Despite increases in new natural gas well completions, which are
estimated at close to 20,000 in 2003 and will likely grow to more than 23,000
wells per year through 2005, production growth will be modest because of
apparently high decline rates from existing wells. Natural gas demand is
expected to increase by about 1.1 percent in 2004, owing to increasing economic
growth, the continuing rise in electricity demand, and below-average
hydroelectric power levels in the Pacific Northwest. Demand growth in 2005 is
expected to be limited by the prevailing relatively high natural gas end-use
prices.
Short-Term Natural Gas Market Outlook, July 2004
|
||||||
|
|
History |
Projections |
||||
|
|
Apr-04 |
May-04 |
Jun-04 |
Jul-04 |
Aug-04 |
Sep-04 |
|
PRICES
($/MMBtu) |
|
|
|
|
|
|
|
Average Wellhead Price |
5.06 |
5.50 |
5.64 |
5.71 |
5.76 |
5.81 |
|
Residential Price |
9.88 |
10.76 |
11.87 |
12.47 |
12.80 |
12.54 |
|
Electric Utilities Price |
5.69 |
6.19 |
6.13 |
6.22 |
6.27 |
6.35 |
|
|
|
|
|
|
|
|
|
SUPPLY
(Trillion Cubic Feet) |
|
|
|
|
|
|
|
Total Dry Gas Production |
1.568 |
1.617 |
1.562 |
1.617 |
1.620 |
1.572 |
|
Net Imports |
0.269 |
0.269 |
0.258 |
0.269 |
0.270 |
0.262 |
|
Imports |
0.329 |
0.328 |
0.315 |
0.327 |
0.331 |
0.323 |
|
Exports |
0.060 |
0.059 |
0.057 |
0.058 |
0.061 |
0.061 |
|
Suppl. Gaseous Fuels |
0.004 |
0.005 |
0.005 |
0.006 |
0.006 |
0.005 |
|
Total New Supply |
1.841 |
1.891 |
1.825 |
1.892 |
1.896 |
1.839 |
|
|
|
|
|
|
|
|
|
Working Gas in Storage |
|
|
|
|
|
|
|
Opening |
1.028 |
1.227 |
1.607 |
2.006 |
2.315 |
2.610 |
|
Closing |
1.227 |
1.607 |
2.006 |
2.315 |
2.610 |
2.950 |
|
Net Storage Withdrawal |
-0.199 |
-0.380 |
-0.399 |
-0.309 |
-0.295 |
-0.340 |
|
|
|
|
|
|
|
|
|
Total Supply |
1.642 |
1.511 |
1.426 |
1.583 |
1.601 |
1.499 |
|
|
|
|
|
|
|
|
|
Balancing Item |
0.118 |
0.072 |
0.030 |
0.012 |
-0.012 |
-0.091 |
|
|
|
|
|
|
|
|
|
Total Primary Supply |
1.760 |
1.583 |
1.455 |
1.595 |
1.589 |
1.408 |
|
|
|
|
|
|
|
|
|
DEMAND
(Trillion Cubic Feet) |
|
|
|
|
|
|
|
Lease & Plant Fuel |
0.092 |
0.095 |
0.093 |
0.097 |
0.097 |
0.094 |
|
Pipeline Use |
0.050 |
0.046 |
0.044 |
0.049 |
0.048 |
0.042 |
|
Delivered to Consumers |
1.618 |
1.442 |
1.318 |
1.449 |
1.445 |
1.272 |
|
Residential |
0.400 |
0.236 |
0.155 |
0.126 |
0.117 |
0.130 |
|
Commercial |
0.241 |
0.177 |
0.141 |
0.134 |
0.132 |
0.135 |
|
Industrial |
0.603 |
0.564 |
0.521 |
0.550 |
0.556 |
0.534 |
|
Electric Power |
0.374 |
0.465 |
0.502 |
0.639 |
0.640 |
0.472 |
|
Total Demand |
1.760 |
1.583 |
1.455 |
1.595 |
1.589 |
1.408 |
Source: Energy Information Administration, Short-Term
Energy Outlook, July 2004.