
| xxxxx
|
| Home > Natural Gas > Natural Gas Weekly Update |
|
Overview:�
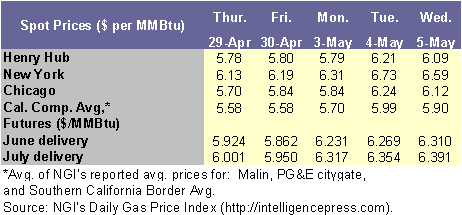
Thursday, May 6 (next release 2:00 p.m. on May 13) Upward pressure on spot and futures natural gas prices
continued for a second consecutive week (Wednesday-Wednesday, April 28-May 5),
owing to continuing concerns over gas supplies and higher crude oil prices. A 42-cent
per MMBtu price increase at the Henry Hub on Tuesday
(May 4) appeared to be related to the increase in futures prices the previous
day, when the near-month contract moved past the $6-mark to a close of $6.231.
The Henry Hub spot price increase on Tuesday and a 2-cent increase last Friday
(April 30) were more than enough to offset declines in the other three trading
sessions this week, resulting in a net gain on the week of 30 cents per MMBtu. The NYMEX futures contract for June delivery at the
Henry Hub was higher on the week by about 34 cents per MMBtu,
closing yesterday (May 5) at $6.31. Natural gas in storage as of Friday, April
30, increased to 1,227 Bcf, which is 2.2 percent
below the 5-year average. Owing to geopolitical concerns and perceived low
gasoline supplies heading into the summer driving season, crude oil prices rose
to almost $40 per barrel this week. The spot price for West Texas Intermediate
(WTI) crude oil increased $2.46 per barrel on the week to yesterday�s closing
price of $39.69 per barrel, or $6.84 per MMBtu. Natural
gas spot prices at most trading locations in the Lower 48 States increased 20
to 40 cents per MMBtu this week, with the largest
gains coming on Tuesday (May 4) as traders responded to rising prices for crude
oil and an upward shift in futures prices the previous day. After reaching as
high as $6.21 per MMBtu on Tuesday, the Henry Hub
spot price traded yesterday at $6.09. The Wednesday-to-Wednesday net gain of 30
cents per MMBtu followed a similar increase in the
previous week. As of yesterday (May 5), the Henry Hub price in the past two
weeks has jumped 57 cents per MMBtu or about 10
percent. Cooling demand likely factored into price increases of 20 cents at the
Southern California Border on Monday, May 3, as an early season heat wave
boosted temperatures to 100 degrees, causing the California Independent System
Operator to call for additional supplemental energy. The request by the
operator of the state�s electricity grid, however, was not a shortage alert.
The Southern California Border price increased to $5.92 per MMBtu
on the week, a gain of 37 cents. Colder weather in the upper Midwest may have
spurred late-season heating demand as prices showed strength in the
Mid-continent producing area, which is connected by pipeline to Midwest
consuming markets. At Ventura, Iowa, the price for spot gas off the Northern
Natural Gas pipeline system gained 40 cents per MMBtu
on the week to yesterday�s price of $5.78. The price at Chicago citygates also increased 40 cents per MMBtu
to $6.12. Rockies trading locations registered the smallest weekly gains,
averaging 16 cents per MMBtu, although increases of
up to 36 cents occurred. The price at the Opal, Wyoming, trading
point increased 18 cents per MMBtu on the week to
$5.36.
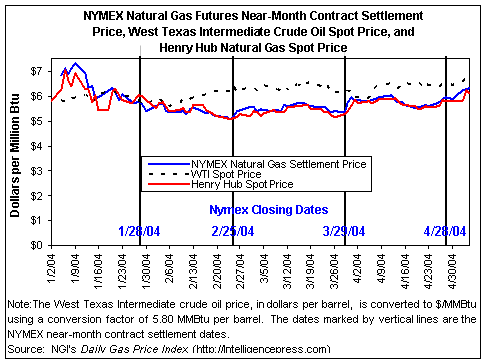
At
the NYMEX, the price of the futures contract for June delivery at the Henry Hub
closed yesterday (May 5) at $6.31 per MMBtu, which is
about 34 cents higher than last Wednesday�s daily settlement. The near-month
contract surged almost 37 cents per MMBtu on Monday
(May 3) to $6.231, owing to factors including rising oil prices and forecasts
of hotter-than-normal temperatures for the summer. The NYMEX near-month price
registered relatively small increases of about 4 cents on both Tuesday and
Wednesday, ending the week at the highest price for a near-month contract since
January 14, 2004. At $6.31 per MMBtu, the June 2004
contract is also at a record high for that delivery month. The basis
differential between the Henry Hub spot price and price of the futures contract
for delivery in January 2005 increased to well over 50 cents per MMBtu each day during the week and approached $1 on one day.
As a result, the basis continues to provide suppliers an incentive to inject
gas into storage in preparation for heating demand next winter. The 12-month
strip, or the average price for contracts over the next year (i.e., June 2004 �
May 2005), closed yesterday at $6.37, a gain of 25 cents on the week.� Recent Natural Gas
Market Data
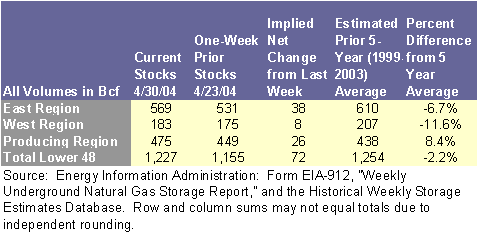
Estimated
working gas in underground storage was 1,227 Bcf as
of April 30, which is 2.2 percent below the 5-year average inventory level for
the report week, according to EIA�s Weekly Natural
Gas Storage Report (See
Storage Figure). The implied net
change in inventories was an injection of 72 Bcf,
which is about 11 percent higher than the 5-year average injection of 65 Bcf but 12 percent lower than last year�s injection of 82 Bcf for the report week. As a result, the year-to-year
surplus in inventories dropped to 391 Bcf, while the
deficit to the 5-year average fell slightly to 27 Bcf.
The implied net injection in the Producing region equaled last week�s 26 Bcf, while net injections in the large East region fell to
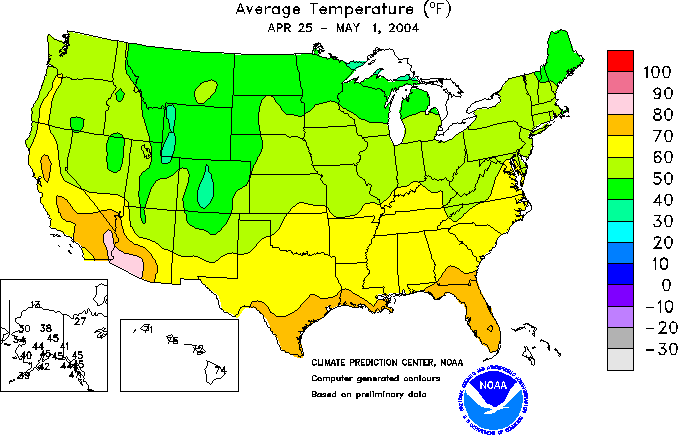
38 Bcf. During the report week, the weather in the
West was much warmer than usual, likely contributing to cooling demand, as
measured by cooling degree days (CDDs) for the week ending
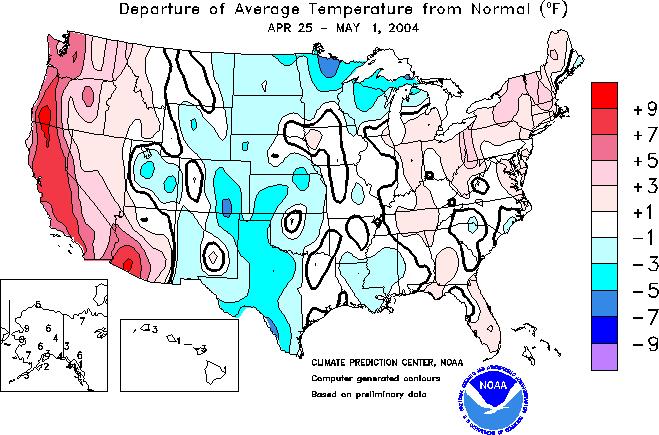
May 1, according to the National Weather Service (See Temperature Map)
(See Deviations Map).� In the Pacific Census region, CDDs numbered 24, compared with a normal level of 5.
Seasonally mild temperatures throughout the rest of the country, however, likely
generated little weather-sensitive demand, allowing for the continuing
injections. Temperatures in major consuming areas were generally mild. For
example, in the East North Central region, which includes Chicago, heating
degree days numbered 75, which was 16 percent below normal.
Other
Market Trends: Canada Provides Financial Incentive for
Increased Gas and Oil Drilling:� The Canadian Minister of Natural Resources, John Effords, recently announced that the Canadian government
has begun a 5-year moratorium on its drilling-rig import fee in an effort to
boost gas and oil exploration and production in Canada.� The fee of 50,000 Canadian dollars per day
was intended to spur the use of Canadian-built rigs.� Minister Effords
was quoted in the trade press as having stated, during a presentation at the
Offshore Technology Conference in Houston, TX, �We want more companies to come
to Canada and do exploration.� The more drilling, the more opportunity.�� He also stated that the suspended import fee
provided about C$10 million per year of revenue to the Canadian government, but
that Canada was willing to forego the potential revenues of about C$50 million
over the life of the moratorium for the potential greater gains associated with
increased exploration and production as more companies come to Canada.� As to the related issue of drilling
regulation, Minister Effords stated that Canada is
working to streamline its process for drilling regulation, and that by year�s
end the government will complete a major overhaul of its regulatory regime to
make it easier for companies to enter and do business in Canada. Gas-Rig Count Reaches 1,000 for Second
Time in the Month of April:� According to the most recent data from Baker-Hughes,
Inc., the count of rigs drilling natural gas prospects in the United States
reached 1,002 as of the week ended Friday, April 30.� For the week ended Friday, April 2, the rig
count was an even 1,000.� Prior to April
2, the last time that the count of natural gas rigs exceeded 1,000 was for the
week ended August 31, 2001, when the count stood at 1,030.� The most recent count of 1,002 is over 21
percent greater than for this same week last year.� Meanwhile, rigs drilling oil prospects fell
by about 9 percent year-on-year, from 174 to 158, having recovered somewhat
from the low of 137 as of the week ended January 23, 2004.� The ratio of natural gas to oil rigs
currently stands at 86.3 percent.� One
year ago this ratio was 82.5 percent.�
After reaching an all-time peak over the nearly 18 years of Baker-Hughes
data of 1,068 for the week ended July 13, 2001, the gas-rig count fell to 591
two years ago.� From that low in the week
ended April 5, 2002, gas rigs have grown by 70 percent. Summary: Natural
gas spot prices at most market locations increased 20 to 40 cents per MMBtu owing to higher crude oil prices and the prospect of
higher demand with the approaching cooling season. The NYMEX price for November
delivery at the Henry Hub climbed about 34 cents per MMBtu
to a close of $6.31 on Wednesday, May 5. Natural gas in storage increased to
1,227 Bcf, reducing the deficit to the 5-year average
volume in storage. The implied net increase in storage inventories on the week
was 72 Bcf. Natural
Gas Summary from the Short-Term Energy Outlook | ||||||||||||||||||||||||||||||||||||||||||
| http://tonto.eia.doe.gov/oog/info/ngw/ngupdate.asp | ||||||||||||||||||||||||||||||||||||||||||
phone: 202-586-8800 email: infoctr@eia.doe.gov Specialized Services from NEIC |
||||||||||||||||||||||||||||||||||||||||||
|
phone: 202-586-8959 email: wmaster@eia.doe.gov |
||||||||||||||||||||||||||||||||||||||||||
|
|
||||||||||||||||||||||||||||||||||||||||||
|
|
||||||||||||||||||||||||||||||||||||||||||
|
|
||||||||||||||||||||||||||||||||||||||||||
| . | ||||||||||||||||||||||||||||||||||||||||||
| Renewables | Alternative Fuels | Prices | States | International | Country Analysis Briefs | ||||||||||||||||||||||||||||||||||||||||||
| Environment | Analyses | Forecasts | Processes | Sectors | ||||||||||||||||||||||||||||||||||||||||||