
| xxxxx
|
| Home > Natural Gas > Natural Gas Weekly Update |
|
Overview:� Weather cooperated with the calendar this week, as
the official start of spring on March 20 brought a warming trend and a possible
end to seasonally chilly weather. The absence of wintertime temperatures and
slightly lower oil prices resulted in prices easing 20 to 45 cents per MMBtu
since Wednesday, March 17. On the week (Wednesday-Wednesday, March 17-24), the
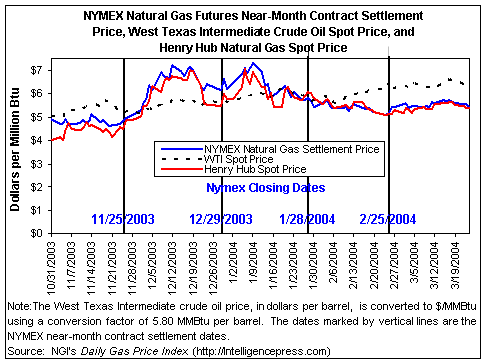
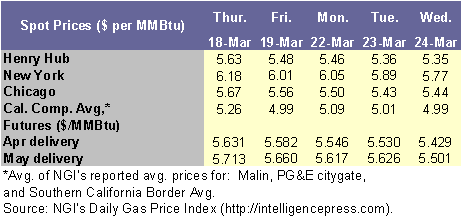
Henry Hub spot price dropped 26 cents per MMBtu to $5.35. The NYMEX futures
contract for April delivery fell 29 cents on the week to close at $5.429
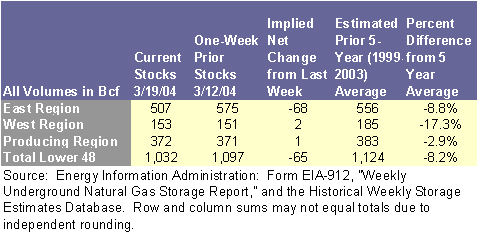
yesterday (March 24). Natural gas in storage as of Friday, March 19, decreased
to 1,032 Bcf, which is 8.2 percent below the 5-year average inventory for the
report week. The spot price for West Texas Intermediate (WTI) crude oil
decreased $1.15 per barrel on the week to yesterday�s closing price of $37.06 per
barrel, or $6.39 per MMBtu. The
transition to spring-like conditions in key space-heating markets in the
At
the NYMEX, the price of the futures contract for April delivery at the Henry
Hub decreased about 29 cents per MMBtu since Wednesday, March 17, to a close of
$5.429 per MMBtu on Wednesday, March 24. As was the case with spot prices, the
near-month contract price fell steadily this week as the soft market conditions
and adequate storage levels reduced upward price pressure. At $5.429 per MMBtu,
the April contract, which expires Monday, March 29, is priced 28 cents higher
than the expiration price of the April 2003 contract. In trading this week, the
May contract declined nearly 30 cents, or 5 percent, to $5.501 per MMBtu.
Further out, the prices from next month through October are all within a narrow
range of just 7 cents. The 12-month strip, or the average price for contracts
over the next year, closed yesterday at $5.736, a decline of 22 cents on the
week.
Working
gas in underground storage decreased to 1,032 Bcf as of Friday, March 19,
according to EIA�s Weekly Natural Gas
Storage Report. Inventories now stand 8.2 percent, or 92 Bcf, below the
5-year average of 1,124 Bcf (See
Storage Figure). Inventories are still 372
Bcf, or 56 percent, higher than last year�s level of 660 Bcf at this time. The
implied net withdrawal for the week was 65 Bcf, which is the largest net
withdrawal so far in March and considerably higher than the 5-year average
implied net change (-41 Bcf). During the comparable report week last year,
there was an implied net injection of 6 Bcf. During the week ending
Recent Natural Gas
Market Data Other
Market Trends: FERC Asserts
Exclusive Jurisdiction over LNG Facilities:�
In
an order issued Wednesday, March 24, the Federal Energy Regulatory Commission
(FERC) concluded that the federal government, and more specifically the
Commission itself, has exclusive regulatory authority over the siting and construction of liquefied natural gas
(LNG) import terminals.� FERC clarified
its authority in an order responding to the California Public Utilities
Commission's (CPUC) claim that EIA Reports Strong Financial Results for
Major Energy Companies:� Twenty-four of the nation�s major energy
companies had a combined increase in net income of nearly 100 percent in 2003,
from $21.5 billion to $42.6 billion, according to information released by the
Energy Information Administration (EIA) on March 18.� (EIA defines major energy companies as �. . .
U.S.-based publicly-owned companies or U.S.-based subsidiaries of
publicly-owned foreign companies that had at least 1 percent of either
production or reserves of oil or gas in the United States, or 1 percent of
either refining capacity or petroleum product sales in the United
States.�)� Net income in the fourth
quarter of 2003 for the group as a whole increased by 43 percent over the third
quarter, to $10.1 billion.� Group
corporate-wide revenues grew by 17 percent in the fourth quarter of 2003 to
$182.8 billion, and by 33 percent for the entire year, to $714.4 billion. The
report (Financial News for Major Energy Companies),
prepared from data compiled from the companies� press releases, attributes the
significantly higher results primarily to a 28.3 percent rise in natural gas
wellhead prices and a 9.4 percent increase in crude oil prices as measured by
the refiner acquisition cost of imported crude oil for the year.� Net income from the domestic production of
oil and gas for the year increased by 62.3 percent to $19.4 billion, while net
income from the �downstream� resale of natural gas and electrical power
increased by 44.7 percent to $3.1 billion.�
These results were obtained despite declines in domestic production for
the group as a whole during the year of nearly 1 percent for natural gas and of
2.4 percent for crude oil. Summary: Natural
gas spot prices decreased at most market locations since Wednesday, March 17,
as milder temperatures reigned in the Lower 48 States.� Prices also fell at the NYMEX futures market
from last week�s level.� However, prices
in both the spot and futures markets remain above last year�s level at this
time.� As of March 19, working gas in
storage decreased to 1,032 Bcf, which is 8.2 percent below the 5-year
average.� Natural
Gas Summary from the Short-Term Energy Outlook | ||||||||||||||||||||||||||||||||||||||||||
| http://tonto.eia.doe.gov/oog/info/ngw/ngupdate.asp | ||||||||||||||||||||||||||||||||||||||||||
phone: 202-586-8800 email: infoctr@eia.doe.gov Specialized Services from NEIC |
||||||||||||||||||||||||||||||||||||||||||
|
phone: 202-586-8959 email: wmaster@eia.doe.gov |
||||||||||||||||||||||||||||||||||||||||||
|
|
||||||||||||||||||||||||||||||||||||||||||
|
|
||||||||||||||||||||||||||||||||||||||||||
|
|
||||||||||||||||||||||||||||||||||||||||||
| . | ||||||||||||||||||||||||||||||||||||||||||
| Renewables | Alternative Fuels | Prices | States | International | Country Analysis Briefs | ||||||||||||||||||||||||||||||||||||||||||
| Environment | Analyses | Forecasts | Processes | Sectors | ||||||||||||||||||||||||||||||||||||||||||