
| xxxxx
|
| Home > Natural Gas > Natural Gas Weekly Update |
|
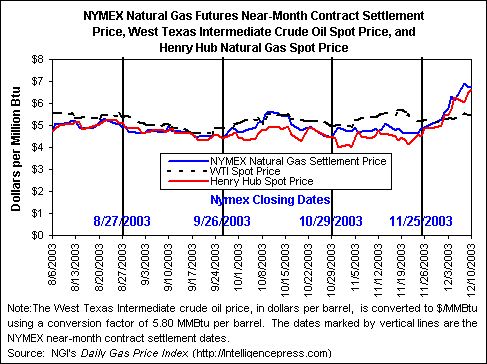
Overview: � Spot and futures prices surged higher for the week
(Wednesday to Wednesday, December 3-10), as the East Coast was struck by two
pre-winter storms that brought record snowfalls to many areas of the Middle
Atlantic and New England over the weekend, along with temperatures as much as
10 degrees below normal.� At the Henry
Hub, the spot price gained $1.20 per MMBtu, or nearly 22 percent, on the week,
ending trading yesterday (Wednesday, December 10) at $6.65.� On the NYMEX, the futures contract for
January delivery increased nearly $1 since the previous Wednesday (December 3),
as it rose $0.955 per MMBtu, or almost 17 percent, to settle at $6.711.� The Energy Information Administration
reported that storage inventories were 2,984 Bcf as of Friday, December 5,
which is 2.7 percent greater than the previous 5-year (1998-2002) average.� The spot price for West Texas Intermediate
crude oil climbed to $31.92 per barrel, or $5.50 per MMBtu�an increase of $1.31
per barrel ($0.12 per MMBtu) since last Wednesday. Spot prices increased in 4
of the 5 trading days of the week, recording the largest week-to-week gains
since late February 2003.� Increases
exceeded $1 per MMBtu at nearly all trading locations, with the largest
increases, up to $1.57 per MMBtu, in the Midcontinent.� Temperatures were colder than normal most
days in many areas of the nation including the entire East Coast and much of
the South as far west as Texas, contributing to strong space heating
demand.� A mid- to late-week snowstorm
in parts of the Midwest, followed by the near-blizzard conditions over the
weekend in the Middle Atlantic and New England, further bolstered prices.� Additionally, the relatively large price
movements in futures market trading also influenced spot trading.� One-day surges of over 58 cents and nearly 77
cents per MMBtu in the settlement price of the near-month contract (for January
delivery) on Thursday (December 4) and Monday (December 8) led to large
differentials with respect to the Henry Hub spot price.� The large spreads provided strong incentive
for industry participants with access to storage capacity to make spot gas
purchases for injection into storage or at least to avoid withdrawing storage
now, given higher expected prices in the future.� For the week, the lowest price increases tended to be in the
Rocky Mountains region, where temperatures were generally well above normal.� In the Midwest, the Chicago citygate price
increased by $1.36 per MMBtu, or 25 percent, to $6.79.� In the Northeast, the price for delivery to
New York citygates increased by $1.08, or about 18 percent, to $7.23 per
MMBtu.��
On the NYMEX, the surging
prices on Thursday (December 4) and Monday (December 8) exceeded the moderate
declines of the other 3 trading days, leaving the January contract at $6.711
per MMBtu, up $0.955 from the previous Wednesday (December 3).� The higher prices for the week likely
reflect the influence of a number of factors.�
The impetus for Thursday�s price jump may be attributed to the reported
net withdrawal of 59 Bcf for the Thanksgiving week.� Its impact on the market may have been accentuated by its
comparison with the 1 Bcf withdrawal reported the week before.� Monday�s spike was probably influenced by
two major factors, including several private weather forecasting services
agreeing, in contrast to the National Weather Service on that day, that the
last part of the month will be colder than normal in many high gas-consuming
areas of the country.� A second factor
is that the NYMEX increased its margin requirements for the first 3 months�
contracts by 40 percent effective at the close of business on Monday, providing
an incentive for some traders, especially non-commercial traders, currently
holding short positions to close them out rather than face expensive margin
calls.� The January contract�s
settlement price of $6.711 yesterday (Wednesday, December 10) has been exceeded
only by near-month contract trading in December 2000-January 2001 (January and
February 2001 contracts) and February-March 2003 (March and April 2003
contracts).
Natural gas stocks stood at 2,984 Bcf as of Friday,
December 5, according to the December 11 release of the Energy Information
Administration�s Weekly Natural Gas
Storage Report.� The implied net
withdrawal of 111 Bcf is about 52 percent greater than the previous 5-year
(1998-2002) average for the week (See Storage Figure) .� Implied net withdrawals in each of the three storage regions
significantly exceeded their respective 5-year averages as well, with the
Producing region�s withdrawal, at 31 Bcf, being double its 5-year average of 15
Bcf.� Nevertheless, total inventories
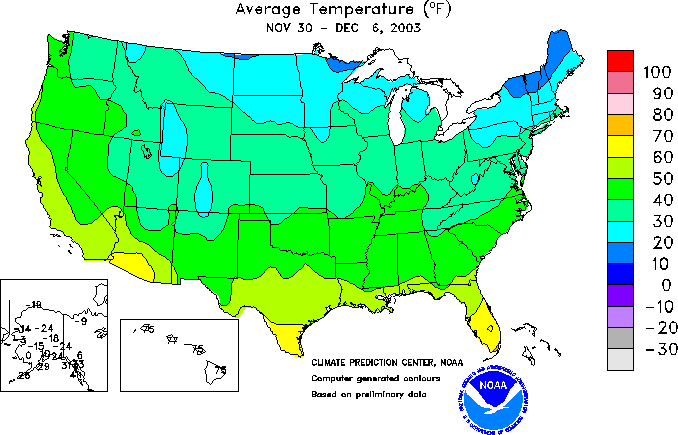
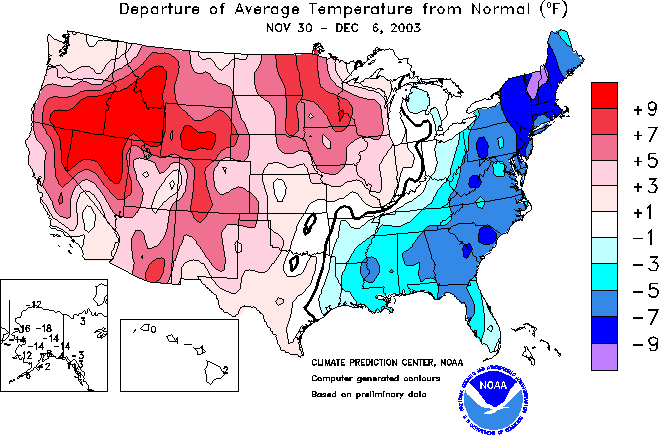
remain above the 5-year average by 2.7 percent.�� The colder-than-normal temperatures that prevailed during the
week ended December 5 for most of the nation east of the Mississippi River (See Temperature Map) (See Deviation Map) certainly contributed to
space-heating demand and encouraged withdrawals from storage.� Four of the five Census Divisions in the
Northeast and South Census Regions recorded gas-customer weighted heating
degree days (HDD) that exceeded normal for the week by 15 percent or more.� The colder temperatures were especially pronounced
in the populous and high-gas consuming Census Divisions along the East Coast,
where the Middle Atlantic, New England, and South Atlantic Divisions were 21.4,
24.3, and� 26.5 percent colder than
normal, respectively, as measured by HDDs.�
Other Market/Industry Trends: FERC Issues
Rulemaking in Response to Changing Structure of the Energy Industry.� In a rule issued on Tuesday, November 25, the Federal Energy
Regulatory Commission (FERC) significantly broadened the scope of energy
affiliates that must conform to the standards of conduct governing the
relationships between transmission providers, which jointly refers to natural
gas pipelines and electric transmission providers, and their affiliates.� According to FERC, �the new standards of
conduct will eliminate the loophole in the current regulations that do not
cover a transmission provider�s relationship with energy affiliates that are
not marketers or merchant affiliates.��
Since the adoption of FERC Order 636 requiring interstate pipelines to
unbundle gas sales from transportation, the market has expanded to include both
physical and financial transactions by marketing and non-marketing gas pipeline
affiliates.� As a result of growth and
consolidations, many interstate natural gas pipelines have a wide array of
affiliates in all sectors of the energy market.� Along with the changing nature of the energy affiliates, the
changing nature of the transmission providers themselves and the growing
convergence of the gas and electric industries prompted the FERC rulemaking.� In FERC�s view, this rulemaking will ensure
that transmission providers cannot extend their market power over transmission
into wholesale energy markets by giving their energy affiliates preferential
treatment. Natural Gas
Summary from the Short-Term Energy Outlook: The Energy Information Administration (EIA) projects
that natural gas wellhead prices will average $4.41 per MMBtu in December 2003,
although spot prices are expected to average $5.38 (Short-Term
Energy Outlook, December 2003). The average wellhead price is expected to
increase moderately to $4.56 during the first three months of 2004.� Natural gas prices were
lower in November than previously expected but forward price expectations
remain sensitive to weather conditions.�
Prices increased rapidly in futures trading in early December as some
cold weather moved into the Eastern United States and reported withdrawals from
gas storage were slightly larger than expected.� Spot prices above $5 per MMBtu remain likely over the next few
months if normal (or colder) weather prevails, especially with oil prices
remaining at relatively high levels.�
Natural gas storage levels are still above average and hold the
potential to push prices back down if warm temperatures and weak heating demand
materialize later in the winter, just as upward spikes remain a strong
possibility if the weather turns cold. Natural gas demand is expected to show a decline of
2.3 percent in 2003 largely owing to high prices discouraging demand in the
industrial and electric power sectors.�
However, expected growth in the economy, along with somewhat lower
projected annual average prices, are expected to increase demand by nearly 1
percent in 2004.� Natural gas production
is expected to increase by about 2.4 percent this year, but to fall back
somewhat in 2004 as drilling intensity declines.� In 2004, the projected supply gap between demand and production is
offset by the expectation that storage injection requirements will be less than
those of 2003, when stocks after the winter of 2002-2003 were at record lows.
Source:� Energy Information Administration, Short-Term
Energy Outlook, December 2003. | |||||||||||||||||||||||||||||||||||||||||||||||||||||||||||||||||||||||||||||||||||||||||||||||||||||||||||||||||||||||||||||||||||||||||||||||||||||||||||||||||||||||||||||||||||||||||||||||||||||||||||||||||||||||||||||||||||||||||||||||||||||||||||||||||||||||||||||||||||||||||||||||||||||||||||||||||||||||||||||||||||||||||||||||||||||||||||||||||||||||||||||||||||||||||||||||||||||||||||||||||||||||||
| http://tonto.eia.doe.gov/oog/info/ngw/ngupdate.asp | |||||||||||||||||||||||||||||||||||||||||||||||||||||||||||||||||||||||||||||||||||||||||||||||||||||||||||||||||||||||||||||||||||||||||||||||||||||||||||||||||||||||||||||||||||||||||||||||||||||||||||||||||||||||||||||||||||||||||||||||||||||||||||||||||||||||||||||||||||||||||||||||||||||||||||||||||||||||||||||||||||||||||||||||||||||||||||||||||||||||||||||||||||||||||||||||||||||||||||||||||||||||||
phone: 202-586-8800 email: infoctr@eia.doe.gov Specialized Services from NEIC |
|||||||||||||||||||||||||||||||||||||||||||||||||||||||||||||||||||||||||||||||||||||||||||||||||||||||||||||||||||||||||||||||||||||||||||||||||||||||||||||||||||||||||||||||||||||||||||||||||||||||||||||||||||||||||||||||||||||||||||||||||||||||||||||||||||||||||||||||||||||||||||||||||||||||||||||||||||||||||||||||||||||||||||||||||||||||||||||||||||||||||||||||||||||||||||||||||||||||||||||||||||||||||
|
phone: 202-586-8959 email: wmaster@eia.doe.gov |
|||||||||||||||||||||||||||||||||||||||||||||||||||||||||||||||||||||||||||||||||||||||||||||||||||||||||||||||||||||||||||||||||||||||||||||||||||||||||||||||||||||||||||||||||||||||||||||||||||||||||||||||||||||||||||||||||||||||||||||||||||||||||||||||||||||||||||||||||||||||||||||||||||||||||||||||||||||||||||||||||||||||||||||||||||||||||||||||||||||||||||||||||||||||||||||||||||||||||||||||||||||||||
|
|
|||||||||||||||||||||||||||||||||||||||||||||||||||||||||||||||||||||||||||||||||||||||||||||||||||||||||||||||||||||||||||||||||||||||||||||||||||||||||||||||||||||||||||||||||||||||||||||||||||||||||||||||||||||||||||||||||||||||||||||||||||||||||||||||||||||||||||||||||||||||||||||||||||||||||||||||||||||||||||||||||||||||||||||||||||||||||||||||||||||||||||||||||||||||||||||||||||||||||||||||||||||||||
| . | |||||||||||||||||||||||||||||||||||||||||||||||||||||||||||||||||||||||||||||||||||||||||||||||||||||||||||||||||||||||||||||||||||||||||||||||||||||||||||||||||||||||||||||||||||||||||||||||||||||||||||||||||||||||||||||||||||||||||||||||||||||||||||||||||||||||||||||||||||||||||||||||||||||||||||||||||||||||||||||||||||||||||||||||||||||||||||||||||||||||||||||||||||||||||||||||||||||||||||||||||||||||||
| Renewables | Alternative Fuels | Prices | States | International | Country Analysis Briefs | |||||||||||||||||||||||||||||||||||||||||||||||||||||||||||||||||||||||||||||||||||||||||||||||||||||||||||||||||||||||||||||||||||||||||||||||||||||||||||||||||||||||||||||||||||||||||||||||||||||||||||||||||||||||||||||||||||||||||||||||||||||||||||||||||||||||||||||||||||||||||||||||||||||||||||||||||||||||||||||||||||||||||||||||||||||||||||||||||||||||||||||||||||||||||||||||||||||||||||||||||||||||||
| Environment | Analyses | Forecasts | Processes | Sectors | |||||||||||||||||||||||||||||||||||||||||||||||||||||||||||||||||||||||||||||||||||||||||||||||||||||||||||||||||||||||||||||||||||||||||||||||||||||||||||||||||||||||||||||||||||||||||||||||||||||||||||||||||||||||||||||||||||||||||||||||||||||||||||||||||||||||||||||||||||||||||||||||||||||||||||||||||||||||||||||||||||||||||||||||||||||||||||||||||||||||||||||||||||||||||||||||||||||||||||||||||||||||||