
| xxxxx
|
| Home > Natural Gas > Natural Gas Weekly Update |
|
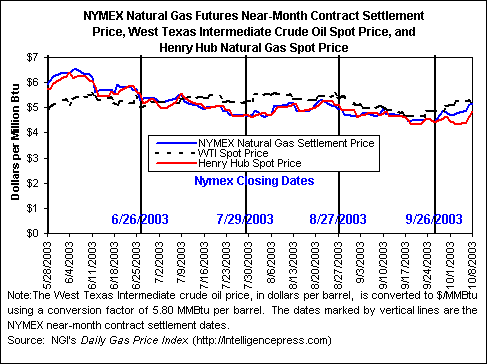
Overview: � Since Wednesday, October 1, natural gas spot prices
have increased at virtually all market locations in the Lower 48 States.� For the week (Wednesday-Wednesday), prices
at the Henry Hub increased 37 cents or 8 percent to $4.84 per MMBtu.� Prices climbed despite moderating
temperatures in the Lower 48 States as the market expected a return to cold
temperatures.� Yesterday (Wednesday,
October 8), the price of the NYMEX futures contract for November delivery at
the Henry Hub was over 47 cents more than last Wednesday�s price.� Natural gas in storage increased to 2,863
Bcf as of October 3, which is about 1 percent below the 5-year average.� The spot price for West Texas Intermediate
(WTI) crude oil moved down $0.17 per barrel or about 1 percent since last
Wednesday to $29.60 per barrel or $5.148 per MMBtu.
Spot prices
have climbed more than 30 cents at nearly all market locations east of the
Rockies since last Wednesday (October 1), while prices in the West had more
modest increases of less than 29 cents per MMBtu.� At the New York citygate and Algonquin citygate, which serves the
New England area, prices climbed 44 and 49 cents per MMBtu to $5.24 and $5.34,
respectively.� The largest increase in
price since last Wednesday occurred in Texas, where the price spiked 54 cents or
nearly 13 percent to average $4.83 per MMBtu on Wednesday, October 8. The
majority of the increases in spot prices have occurred since Monday, October 6,
as prices climbed between 20 and 51 cents.�
Contributing factors to the increase in prices likely included market
expectations regarding a colder than normal winter and continued larger than
average storage additions.
At the NYMEX, the price of the futures contract for
November delivery at the Henry Hub climbed more than 47 cents during the week
to settle at $5.148 per MMBtu on Wednesday, October 8.� Prices of the futures contracts for delivery
during the remaining months in the 2003-2004 heating season increased roughly
40 to 47 cents per MMBtu since last Wednesday.�
Despite moderating weather conditions in the Lower 48 States, futures
prices rallied on Friday, October 3, as the market expected an imminent return
to cold temperatures.� As futures prices
surged, the contracts for delivery in the heating season months increasingly
traded at a premium to the Henry Hub spot price, with the November 2003 and the
January 2004 contracts peaking at more than 50 and 95 cents above the Henry Hub
spot price Yesterday, prices of the contracts for the peak winter months of
December through February were 57 cents to 73 cents higher than the current
Henry Hub spot price.� This relative
price pattern remains a strong incentive for additions of natural gas to
storage for the winter heating season. �
Hurricane Isabel caused most federal government
operations to be suspended on Thursday and Friday, September 18-19.� Consequently, the Natural Gas Weekly Update for September 18 was not published.� The table of daily natural gas prices that
would have appeared in that issue is included below. Prices
for Sept 11 � Sept 17.
Working gas in storage was 2,863 Bcf as of Friday,
October 3, 2003, according to the EIA Weekly Natural Gas Storage Report. (See
Storage Figure)� This is roughly 1 percent
below the 5-year average for the report week and 7 percent below the level last
year for the same week.� The implied net
injection during the report week was 75 Bcf, which is about 32 percent more
than the 5-year average of 57 Bcf for the week, continuing the pattern of
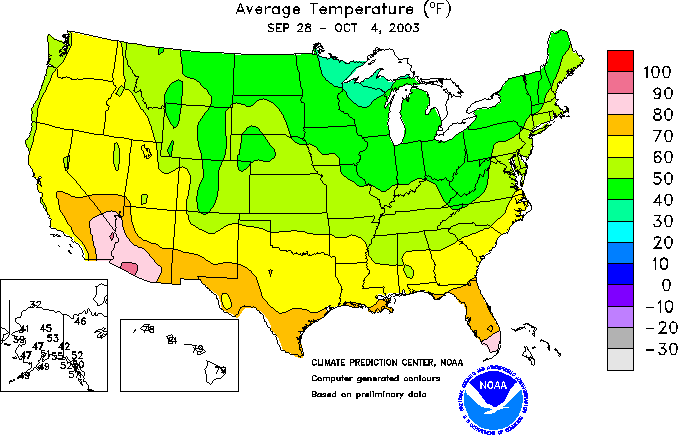
larger-than-average net injections during this refill season.� However, cooler-than-normal temperatures
across much of the Lower 48 States, helped end the 3-week streak of
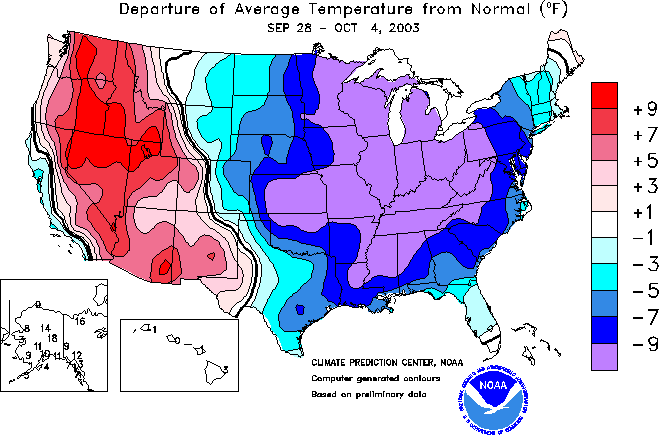
triple-digit injections (See Temperature Map.)
(See Deviation Map.)� The year-on-year storage deficit has declined for 23
of the past 24 weeks, falling 33 Bcf to 217 Bcf.� To reach the 3 trillion cubic foot mark by November 2003, net
injections would have to average roughly 34 Bcf per week for the remainder of
the refill season.
Other Market Trends: Gas Shut-ins
to Date Less than Expected in Alberta: About 95 million cubic feet per day (MMcf/d) of gas
production in Alberta is currently shut in following the Canadian province�s
Energy and Utilities Board�s (EUB) recent decision to cease operations in areas
of the Athabasca Oil Sands. Gas production has been interrupted owing to
concerns that production would jeopardize oil sands reservoir pressures in the
Wabiskaw-McMurry area in northeastern Alberta. The amount of bitumen from the
oil sands in the area has an energy value nearly 600 times that of the gas that
could be produced from the area, EUB says. Approximately 338 wells have been
shut in to date, or about 41 percent of the production from the area, which
covers 5.5 million acres. Original projections had been that nearly 250 MMcf/d
would be shut in to date, but the EUB has exempted at least 600 gas wells from
its decision. The EUB granted temporary exemptions to operators of wells that
have shown evidence that natural gas extraction will not affect the potential
extraction of bitumen. Those temporary waivers will be re-examined throughout
the fall. Natural Gas Summary from the
Short-Term Energy Outlook: The Energy Information
Administration (EIA) projects that natural gas wellhead prices will average
$4.17 per MMBtu during the last 3 months of 2003 and increase to $4.32 in
January 2004 (Short-Term
Energy Outlook, October 2003). Prices have fallen somewhat from the unusually
high levels that prevailed in the first half of the year and most of July, as
mild summer weather and reduced industrial demand allowed record storage refill
rates. As of October 3, 2003, working gas levels were only 1 percent below the
5-year average and, barring any disruptions, are on target to reach 3 Tcf by
the end of October. With the improved storage situation, wellhead prices during
the upcoming heating season (November through March), assuming normal weather,
are expected to be about 13 percent less than last winter ($4.17 vs. $4.68 per
MMBtu). But prices in the residential sector are projected to be about 9 percent
higher than last winter, as the recent decline in wellhead prices is too recent
and insufficient to offset the impact of the substantial spring-summer increase
in wellhead prices on residential prices. Overall in 2003, wellhead prices are
expected to average $4.75 per MMBtu, which is nearly $2 more than the 2002
annual average and the largest year-to-year increase on record. For 2004, wellhead prices
are projected to drop by nearly $0.90 per MMBtu, or about 20 percent, to $3.86
per MMBtu as the overall supply situation improves. Natural gas production is expected to increase by
about 2.1 percent in 2003. Following the downturn in natural gas-directed
drilling activity in 2002, higher natural gas prices and sharply higher oil and
natural gas field revenues continue to drive the resurgence in drilling this
year. The number of rigs drilling for natural gas has totaled more than 900
since the week ending June 13 and averaged 932 in August and 936 in September.
In 2004, production is expected to remain at modestly improved levels. The
prospects for significant reductions in natural gas wellhead prices in 2004
depend on the productivity of the expected upsurge in drilling. Natural
gas demand is expected to fall by about 1.1 percent in 2003 because of reduced demand
in the industrial sector and electric power sectors as a result of high prices
and the sharply lower weather-related demand following the first quarter of
2003. This winter, assuming normal weather, natural gas demand is expected to
be about 2.4 percent less than last winter�s level as gas-weighted heating
degree-days for the season (Q4 2003 and Q1 2004) are projected to be about 3.7
percent less than year-ago levels. Overall in 2004, natural gas demand is
expected to increase because of accelerated economic growth and generally lower
prices.
Source:� Energy Information Administration, Short-Term
Energy Outlook, October 2003.
| ||||||||||||||||||||||||||||||||||||||||||||||||||||||||||||||||||||||||||||||||||||||||||||||||||||||||||||||||||||||||||||||||||||||||||||||||||||||||||||||||||||||||||||||||||||||||||||||||||||||||||||||||||||||||||||||||||||||||||||||||||||||||||||||||||||||||||||||||||||||||||||||||||||||||||||||||||||||||||||||||||||||||||||||||||||||||||||||||||||||||||||||||||||||||||||||||||||||||||||||||||||||||||||||||||||||||||||||||||||||||||||||||||||||||||||||||||||||||||||||||
| http://tonto.eia.doe.gov/oog/info/ngw/ngupdate.asp | ||||||||||||||||||||||||||||||||||||||||||||||||||||||||||||||||||||||||||||||||||||||||||||||||||||||||||||||||||||||||||||||||||||||||||||||||||||||||||||||||||||||||||||||||||||||||||||||||||||||||||||||||||||||||||||||||||||||||||||||||||||||||||||||||||||||||||||||||||||||||||||||||||||||||||||||||||||||||||||||||||||||||||||||||||||||||||||||||||||||||||||||||||||||||||||||||||||||||||||||||||||||||||||||||||||||||||||||||||||||||||||||||||||||||||||||||||||||||||||||||
phone: 202-586-8800 email: infoctr@eia.doe.gov Specialized Services from NEIC |
||||||||||||||||||||||||||||||||||||||||||||||||||||||||||||||||||||||||||||||||||||||||||||||||||||||||||||||||||||||||||||||||||||||||||||||||||||||||||||||||||||||||||||||||||||||||||||||||||||||||||||||||||||||||||||||||||||||||||||||||||||||||||||||||||||||||||||||||||||||||||||||||||||||||||||||||||||||||||||||||||||||||||||||||||||||||||||||||||||||||||||||||||||||||||||||||||||||||||||||||||||||||||||||||||||||||||||||||||||||||||||||||||||||||||||||||||||||||||||||||
|
phone: 202-586-8959 email: wmaster@eia.doe.gov |
||||||||||||||||||||||||||||||||||||||||||||||||||||||||||||||||||||||||||||||||||||||||||||||||||||||||||||||||||||||||||||||||||||||||||||||||||||||||||||||||||||||||||||||||||||||||||||||||||||||||||||||||||||||||||||||||||||||||||||||||||||||||||||||||||||||||||||||||||||||||||||||||||||||||||||||||||||||||||||||||||||||||||||||||||||||||||||||||||||||||||||||||||||||||||||||||||||||||||||||||||||||||||||||||||||||||||||||||||||||||||||||||||||||||||||||||||||||||||||||||
|
|
||||||||||||||||||||||||||||||||||||||||||||||||||||||||||||||||||||||||||||||||||||||||||||||||||||||||||||||||||||||||||||||||||||||||||||||||||||||||||||||||||||||||||||||||||||||||||||||||||||||||||||||||||||||||||||||||||||||||||||||||||||||||||||||||||||||||||||||||||||||||||||||||||||||||||||||||||||||||||||||||||||||||||||||||||||||||||||||||||||||||||||||||||||||||||||||||||||||||||||||||||||||||||||||||||||||||||||||||||||||||||||||||||||||||||||||||||||||||||||||||
| . | ||||||||||||||||||||||||||||||||||||||||||||||||||||||||||||||||||||||||||||||||||||||||||||||||||||||||||||||||||||||||||||||||||||||||||||||||||||||||||||||||||||||||||||||||||||||||||||||||||||||||||||||||||||||||||||||||||||||||||||||||||||||||||||||||||||||||||||||||||||||||||||||||||||||||||||||||||||||||||||||||||||||||||||||||||||||||||||||||||||||||||||||||||||||||||||||||||||||||||||||||||||||||||||||||||||||||||||||||||||||||||||||||||||||||||||||||||||||||||||||||
| Renewables | Alternative Fuels | Prices | States | International | Country Analysis Briefs | ||||||||||||||||||||||||||||||||||||||||||||||||||||||||||||||||||||||||||||||||||||||||||||||||||||||||||||||||||||||||||||||||||||||||||||||||||||||||||||||||||||||||||||||||||||||||||||||||||||||||||||||||||||||||||||||||||||||||||||||||||||||||||||||||||||||||||||||||||||||||||||||||||||||||||||||||||||||||||||||||||||||||||||||||||||||||||||||||||||||||||||||||||||||||||||||||||||||||||||||||||||||||||||||||||||||||||||||||||||||||||||||||||||||||||||||||||||||||||||||||
| Environment | Analyses | Forecasts | Processes | Sectors | ||||||||||||||||||||||||||||||||||||||||||||||||||||||||||||||||||||||||||||||||||||||||||||||||||||||||||||||||||||||||||||||||||||||||||||||||||||||||||||||||||||||||||||||||||||||||||||||||||||||||||||||||||||||||||||||||||||||||||||||||||||||||||||||||||||||||||||||||||||||||||||||||||||||||||||||||||||||||||||||||||||||||||||||||||||||||||||||||||||||||||||||||||||||||||||||||||||||||||||||||||||||||||||||||||||||||||||||||||||||||||||||||||||||||||||||||||||||||||||||||