
Overview:
Spot prices fluctuated mildly during the week
(Wednesday to Wednesday, September 17-24), with the majority of changes in
either direction limited to a nickel or less.
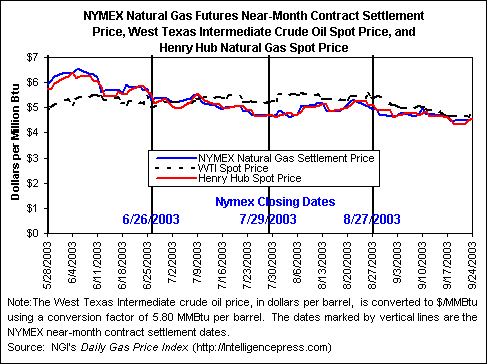
For the week, prices generally were lower than last Wednesday. At the Henry Hub, the spot price declined 2
cents on the week, ending trading yesterday (September 24) at $4.59 per
MMBtu. The NYMEX futures contract for
October delivery ended the week down by $0.054 per MMBtu from the previous
Wednesday (September 17), settling at $4.588 per MMBtu, as a significant
one-day decline of 17 cents on Thursday (September 18) was not offset by four
straight trading sessions with small increases. EIA reported that working gas inventories were 2,688 Bcf as of
Friday, September 19, which is 3.3 percent below the 5-year (1998-2002)
average. In oil markets, yesterday’s
announcement by the OPEC oil cartel of a production quota cut of 900,000
barrels per day sent crude oil and heating oil futures contract prices up
sharply. The spot price for West Texas
Intermediate crude oil accrued its entire increase for the week in yesterday’s
trading, as it gained $1.19 to $28.19 per barrel, or about $4.86 per MMBtu.
Despite an upward trend
over the past three days in nearly all locations, price increases in most
production areas and in the Midwest and Midcontinent were not quite enough to
overcome the sizeable decreases of Thursday and Friday (September 18-19),
leaving prices in these areas several pennies less than the previous week’s
levels. Conversely, spot prices at most locations in the Rocky Mountains and
the Northeast saw weekly gains of a few cents.
The passage of Hurricane Isabel from the North Carolina coast up through
the Mid-Atlantic last Thursday and Friday (September 18-19) knocked out
electrical power for well over a million consumers and temporarily eliminated
gas-fired generation demand in a wide swath along Isabel’s path. Elsewhere, with the exception of
cooler-than-normal temperatures in some Great Plains and Rocky Mountain states,
temperatures for the most part have been typically seasonal, with little in the
way of high or low extremes to generate swing demand. However, in the past two days a slight cooling trend in the
Midwest and parts of the Northeast has led to some furnaces being turned on,
providing some support to spot prices. For the week, the Chicago citygate price
was down by 2 cents to $4.67 per MMBtu, while spot gas for delivery to New York
citygates rose 3 cents to $5.01.
|
Spot Prices ($ per MMBtu) |
Thur. |
Fri. |
Mon. |
Tues. |
Wed. |
|
18-Sep |
19-Sep |
22-Sep |
23-Sep |
24-Sep |
|
|
Henry Hub |
4.51 |
4.33 |
4.37 |
4.51 |
4.59 |
|
New York |
4.88 |
4.64 |
4.79 |
4.92 |
5.01 |
|
Chicago |
4.57 |
4.40 |
4.49 |
4.63 |
4.67 |
|
Cal. Comp. Avg,* |
4.42 |
4.14 |
4.35 |
4.47 |
4.55 |
|
Futures ($/MMBtu) |
|
|
|
|
|
|
Oct delivery |
4.471 |
4.483 |
4.494 |
4.511 |
4.588 |
|
Nov delivery |
4.724 |
4.705 |
4.723 |
4.697 |
4.752 |
|
*Avg. of NGI's reported
avg. prices for: Malin, PG&E
citygate, |
|||||
|
and Southern California
Border Avg. |
|||||
|
Source: NGI's Daily Gas
Price Index (http://intelligencepress.com). |
|||||
In the futures market, two
consecutive weeks of triple-digit net additions to storage likely contributed
to significant drops in futures prices on the Thursdays (September 11 and 18)
when the weekly storage reports for those weeks were released. The near-month contract (October delivery)
fell $0.230 per MMBtu on Thursday, September 11, and last Thursday it dropped
$0.171 to $4.471 per MMBtu, reaching the lowest settlement price for a
near-month contract since early December of last year. Since then, except for yesterday, October’s
price has crept up by less than 2 cents per day, as National Weather Service
short-term forecasts have been consistently predicting lower-than-normal
temperatures for virtually the entire eastern half of the nation through the
beginning of next month. The October
contract gained nearly 8 cents in yesterday’s trading, helped along by sizeable
gains in heating oil futures contract prices, settling at $4.588 per
MMBtu.
|
Estimated Average Wellhead Prices |
||||||
|
|
Mar-03 |
Apr-03 |
May-03 |
Jun-03 |
Jul-03 |
Aug-03 |
|
Price ($ per Mcf) |
6.69 |
4.71 |
4.97 |
5.35 |
4.91 |
4.72 |
|
Price ($ per MMBtu) |
6.52 |
4.59 |
4.84 |
5.21 |
4.79 |
4.60 |
|
Note: The price data in this table are a pre-release of the average
wellhead price that will be published in forthcoming issues of the Natural
Gas Monthly. Prices were converted
from $ per Mcf to $ per MMBtu using an average heat content of 1,025 Btu per
cubic foot as published in Table A2 of the Annual Energy Review
2001. |
||||||
|
Source: Energy Information Administration, Office
of Oil and Gas. |
||||||
Working gas in storage increased by 100 Bcf to 2,688
Bcf as of Friday, September 19, reducing the deficit from the 5-year (1998-2002)
average by more than 1 percentage point to 3.3 percent. (See
Storage Figure). This marks the second
consecutive week of implied net injections of 100 Bcf or more. The net stock additions of the past two
weeks have been the highest and second highest in the last two months of the
traditional refill season in the near-10 year history of EIA weekly storage
data. Net additions for the report week
ranged from 25 percent greater than the 5-year average in the East region to
over 71 percent greater in the West region.
Inventories in the West region have exceeded the 5-year average for 3
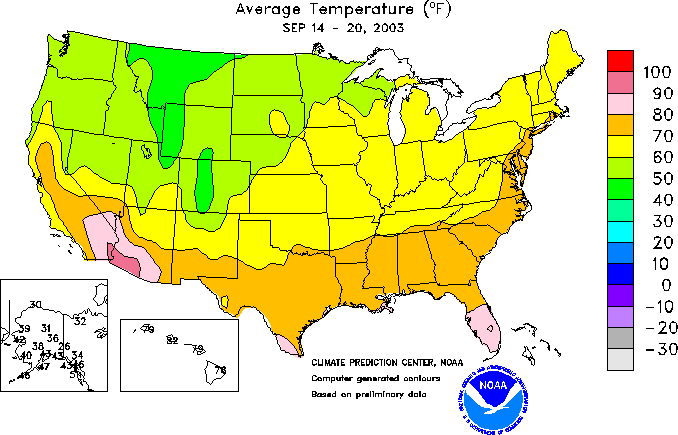
consecutive weeks, growing to 3.2 percent above the average. The weather during the report week was very
conducive to storage injections. (See Temperature Map.)
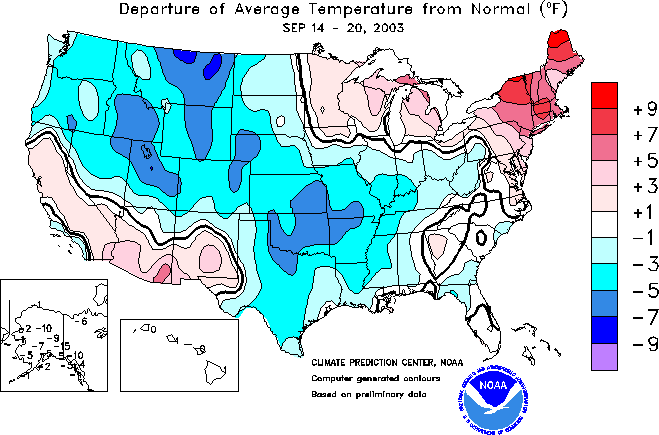
(See Deviation Map) In Census divisions such as the East and West South
Central with significant potential cooling load in a shoulder month, cooling
degree days were more than 10 and nearly 22 percent less than normal,
respectively. Conversely, in the New
England and East and West North Central divisions, which can experience
demand-generating cold temperatures in September and October, gas-customer
weighted heating degree days were nearly 88, 35, and 62 percent less than
normal, respectively.
|
All Volumes
in Bcf |
Current
Stocks 9/19/03 |
Estimated
Prior 5-Year (1998-2002) Average |
Percent
Difference from 5 Year Average |
Implied Net
Change from Last Week |
One-Week
Prior Stocks 9/12/03 |
|
|
East Region |
1,603 |
1,668 |
-3.9% |
60 |
1,543 |
|
|
West Region |
360 |
349 |
3.2% |
12 |
348 |
|
|
Producing
Region |
725 |
764 |
-5.1% |
28 |
697 |
|
|
Total Lower
48 |
2,688 |
2,781 |
-3.3% |
100 |
2,588 |
|
|
Source: Energy Information Administration: Form EIA-912, "Weekly Underground Natural
Gas Storage Report," and the Historical Weekly Storage Estimates
Database. Row and column sums may not
equal totals due to independent rounding.
|
||||||
Other Market Trends:
EIA Proposes
New LNG Storage Survey: The Energy Information
Administration (EIA) is proposing to collect data on U.S. liquefied natural gas
(LNG) storage inventories on a monthly and annual basis. In a notice in the Federal Register of Tuesday, September 16, 2003, EIA officially
proposed Form
EIA-913, “Monthly and Annual Liquefied Natural Gas (LNG) Storage Report,”
“…to collect data on the inventory levels of LNG and operational capacities of
active LNG storage facilities in the United States.” This new data collection
effort was specifically requested by Secretary of Energy Spencer Abraham in an
effort to enhance natural gas market information and efficiency. Survey respondents would include all
operators of facilities that store LNG for baseload, seasonal, and peak demand
delivery in the United States, or for delivery to U.S. customers for these
purposes. Respondents would therefore include operators with LNG inventories
such as distribution companies, pipeline companies, liquefaction facilities,
LNG wholesalers, and marine terminals that provide peaking storage services.
The survey would exclude any industrial, residential, commercial, or power
generation entities that store LNG for ultimate consumption. EIA estimates the
respondent universe to be about 100 currently active facilities. Aggregated data collected via the EIA-913
would be published in EIA’s Monthly
Energy Review, Natural Gas Monthly, and Natural
Gas Annual. The Federal Register notice requests
comments from all interested parties by November 17, 2003.
Summary:
Spot price movements were
mixed during the past week, although prices at most locations ended the week
slightly lower. Temperate
shoulder-season weather and the effects of Hurricane Isabel muted demand, and
large additions to storage signified improved supplies. Futures prices ended the week lower, as
record-large inventory builds continued to improve the winter-supply
outlook.
Natural
Gas Summary from the Short-Term Energy Outlook