
| xxxxx
|
| Home > Natural Gas > Natural Gas Weekly Update |
|
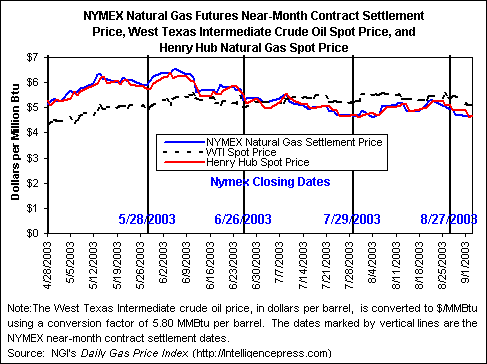
Overview: � Since Wednesday, August 27, natural gas spot prices
have declined at virtually all market locations in the Lower 48 States.� For the week (Wednesday-Wednesday), prices
at the Henry Hub fell 44 cents or 9 percent to $4.68 per MMBtu.� Lighter cooling demand for natural gas owing
to the Labor Day holiday weekend and milder temperatures east of the Rockies
likely contributed to the declines.�
Yesterday (Wednesday, September 3), the price of the NYMEX futures
contract for October delivery at the Henry Hub was almost 19 cents less than
last Wednesday�s price.� Natural gas in
storage increased to 2,389 Bcf as of August 29, which is 7 percent below the
5-year average.� The spot price for West
Texas Intermediate (WTI) crude oil moved down $1.75 per barrel or about 6
percent since last Wednesday to $29.43 per barrel or $5.07 per MMBtu.
Spot prices fell more than 37 cents at virtually all
market locations east of the Rockies, while prices in the West had more modest
declines of less than 28 cents per MMBtu.�
Contributing factors to the fall in prices likely included milder
temperatures east of the Rockies, weather forecasts calling for mild
temperatures, and falling crude oil prices.�
In addition, gas production in the Gulf of Mexico appears to have been
unaffected by recent tropical disturbances�Tropical Storm Grace made landfall
in Texas over the weekend with no significant shut-ins reported, and Hurricane
Fabian appears headed for the East Coast, away from the producing area.� However, temperatures remained relatively
warm in the West, which likely mitigated price declines in the region.� The largest drop in price since last
Wednesday occurred in Louisiana, where the price fell 59 cents or nearly 12
percent to average $4.51 per MMBtu on Wednesday, September 3.� Elsewhere in the East, prices in New York
fell 54 cents or 10 percent to $5.02.�
At the NYMEX, the price of the futures contract for
October delivery at the Henry Hub fell by almost 19 cents during the week to
settle at $4.694 per MMBtu on Wednesday, September 3.� Prices of the futures contracts for delivery during the remaining
months in 2003 fell roughly 20 to 27 cents per MMBtu since last Wednesday.� Yesterday (September 3), the settlement
prices of these contracts declined between 13 and 15 cents.� Prices of the contracts for the peak winter
months of December through February are 55 cents or more above the current
Henry Hub spot price.� This relative
price pattern remains a strong incentive for additions of natural gas to
storage for the winter heating season.
Working
gas in storage was 2,389 Bcf as of Friday, August 29, 2003, according to the
EIA Weekly Natural Gas Storage Report.�
This is roughly 7 percent below the 5-year average for the report week
and 14 percent below the level last year for the same week (See
Storage Figure).� The implied net injection
during the report week� was 70 Bcf,
which is about 21 percent more than the 5-year average of 58 Bcf for the week,
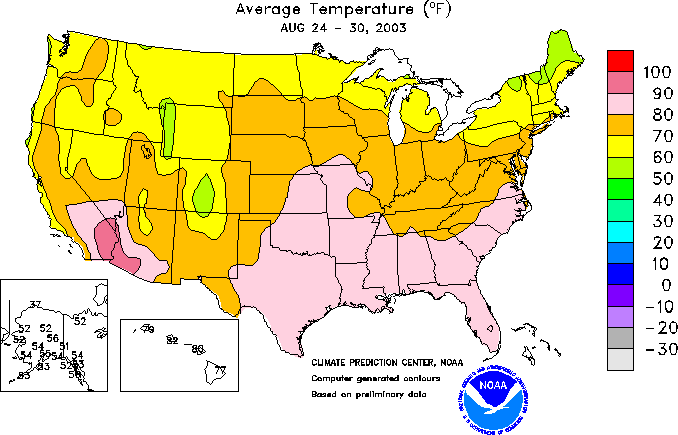
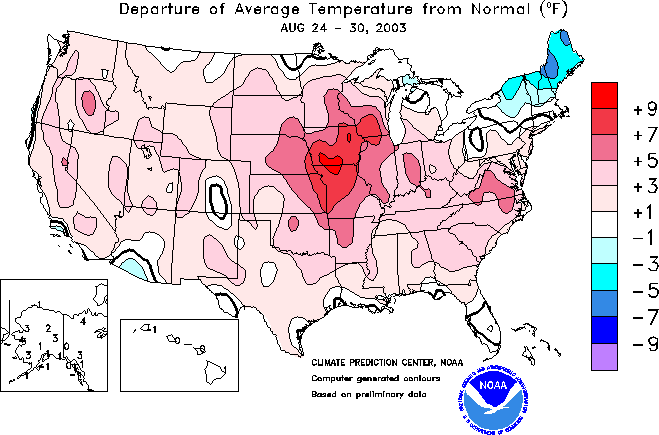
resuming the pattern of larger-than-average net injections into storage.� Relatively mild temperatures in the northern
tier of the Lower 48 States likely contributed to the above average injections
into storage (See Temperature Map.)
(See Deviation Map).� The year-on-year storage deficit has declined for 14
of the past 15 weeks, falling 5 Bcf to 392 Bcf.� To reach the 3 trillion cubic foot mark by November 2003, net
injections would have to average roughly 68 Bcf per week over the next 9 weeks.
Other Market Trends: Marginal Well Production Rises in 2002:
Natural gas production from marginal wells rose 65 billion cubic feet (Bcf) in
2002, or about 5 percent, according to the Interstate Oil and Gas Compact
Commission (IOGCC). In recently-released results of its annual survey, the
IOGCC found
that marginal gas production increased to 1,418 Bcf, which is equal to about 10
percent of total onshore production in the Lower 48 States. Marginal wells,
also known as stripper wells, are those wells that produce 60 thousand cubic
feet (Mcf) per day or less. These wells accounted for 43 percent of the total
increase in gas production onshore in 2002. Overall, domestic onshore
production increased 149 Bcf last year, according to the IOGCC, which
represents the governors of 30 oil- and gas-producing states. The IOGCC noted
marginal well production is important in the national economy, particularly to
small independent operators, or �mom and pop� operations, who tend to be the
operators of marginally-producing wells. Summary: Moderating
cooling demand for natural gas in most parts of the country contributed to
declining prices at most locations across the Lower 48 States and at the NYMEX
futures market.� Working gas in storage
increased to 2,389 Bcf, which is 7 percent below the 5-year average.�� Natural Gas Summary from the
Short-Term Energy Outlook | |||||||||||||||||||||||||||||||||||||||||||||||||||||||||||||||||||||||||||||||||||||||||||||||||||||||||||||||||||||||||||||||||||||||||||||||||||||||||||||
| http://tonto.eia.doe.gov/oog/info/ngw/ngupdate.asp | |||||||||||||||||||||||||||||||||||||||||||||||||||||||||||||||||||||||||||||||||||||||||||||||||||||||||||||||||||||||||||||||||||||||||||||||||||||||||||||
phone: 202-586-8800 email: infoctr@eia.doe.gov Specialized Services from NEIC |
|||||||||||||||||||||||||||||||||||||||||||||||||||||||||||||||||||||||||||||||||||||||||||||||||||||||||||||||||||||||||||||||||||||||||||||||||||||||||||||
|
phone: 202-586-8959 email: wmaster@eia.doe.gov |
|||||||||||||||||||||||||||||||||||||||||||||||||||||||||||||||||||||||||||||||||||||||||||||||||||||||||||||||||||||||||||||||||||||||||||||||||||||||||||||
|
|
|||||||||||||||||||||||||||||||||||||||||||||||||||||||||||||||||||||||||||||||||||||||||||||||||||||||||||||||||||||||||||||||||||||||||||||||||||||||||||||
|
|
|||||||||||||||||||||||||||||||||||||||||||||||||||||||||||||||||||||||||||||||||||||||||||||||||||||||||||||||||||||||||||||||||||||||||||||||||||||||||||||
|
|
|||||||||||||||||||||||||||||||||||||||||||||||||||||||||||||||||||||||||||||||||||||||||||||||||||||||||||||||||||||||||||||||||||||||||||||||||||||||||||||
| . | |||||||||||||||||||||||||||||||||||||||||||||||||||||||||||||||||||||||||||||||||||||||||||||||||||||||||||||||||||||||||||||||||||||||||||||||||||||||||||||
| Renewables | Alternative Fuels | Prices | States | International | Country Analysis Briefs | |||||||||||||||||||||||||||||||||||||||||||||||||||||||||||||||||||||||||||||||||||||||||||||||||||||||||||||||||||||||||||||||||||||||||||||||||||||||||||||
| Environment | Analyses | Forecasts | Processes | Sectors | |||||||||||||||||||||||||||||||||||||||||||||||||||||||||||||||||||||||||||||||||||||||||||||||||||||||||||||||||||||||||||||||||||||||||||||||||||||||||||||