
Overview: Thursday, June 19, 2003 (next release 2:00
p.m. on June 26)
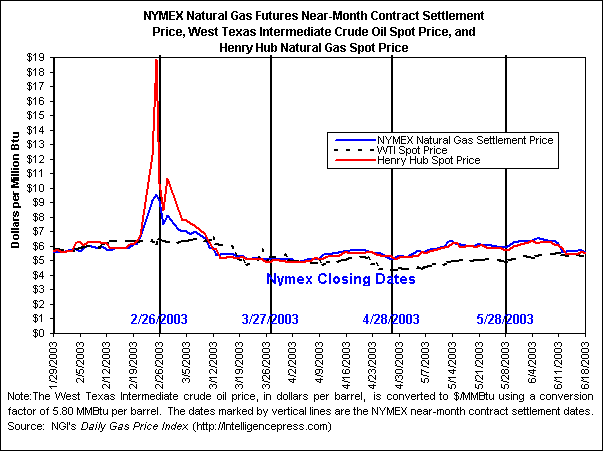
Spot and futures prices fell
for the second straight week, as generally mild temperatures continued to
prevail in most major market areas and storage injections exceeded 100 Bcf for
a third straight week. At the Henry
Hub, the spot price fell by 52 cents per MMBtu on the week (Wednesday to
Wednesday, June 11-19), or almost 9 percent, to $5.54 per MMBtu. The settlement price for the NYMEX futures
contract for July delivery declined by $0.632 on the week, closing yesterday
(June 18) at $5.581 per MMBtu—a decline of 10 percent. The Energy Information Administration (EIA)
reported that working gas in storage was 1,438 Bcf as of Friday, June 13, which
is about 22 percent below the previous 5-year (1998-2002) average for the
week. The spot price for West Texas
Intermediate (WTI) crude oil fell in 4 of 5 trading days, ending the week down
by almost $2 per barrel, at $30.28, or $5.22 per MMBtu.
Despite a post-weekend uptick on Monday (June 16) and a brief price rally
on Tuesday, spot prices declined for the second week in a row, with decreases
at nearly all market locations ranging from 30 to 60 cents per MMBtu. Declines were smaller in the Rocky Mountains
region, as production problems in the Jonah field and pending maintenance on
the Opal gas processing plant in Wyoming, coupled with an Unauthorized Overpull
Penalty on El Paso’s system imposed on Tuesday, led to price gains in that
region the past 3 days. The El Paso
Bondad and non-Bondad price points in the San Juan Basin posted the only
week-to-week price increases in the nation, albeit less than a dime each, to
end the week at $5.06 and $5.09 per MMBtu, respectively—the only Rockies
locations with over-$5 prices.
California prices have also risen in the last 3 days, driven by
increasing Rockies prices as well as by increasing demand from the return of
higher-than-normal temperatures beginning on Sunday in southern and central
California as well as in east-of-California markets in Nevada and Arizona.
Monday’s price increases were the largest, as prices got an additional boost
when increasing demand allowed both SOCAL and PG&E to lift high-linepack OFOs
that had been in effect for the weekend. The increases of the last 3 days held the
week-to-week drop of the Southern California Border Average and PG&E
citygate average prices to 6 and 18 cents per MMBtu, respectively, to $5.29 and
$5.45 per MMBtu, respectively. Outside
of California, the Rockies, and West Texas, average prices for other regional
markets fell by 40 to 51 cents per MMBtu.
Yesterday, there were no over-$6 gas spot prices; the highest priced gas
was for delivery to New York citygates, at $5.95 per MMBtu. Last Wednesday, more than half of all market
locations showed prices of more than $6 per MMBtu.
|
Spot Prices ($ per MMBtu) |
Thur. |
Fri. |
Mon. |
Tues. |
Wed. |
|
12-Jun |
13-Jun |
16-Jun |
17-Jun |
18-Jun |
|
|
Henry Hub |
5.86 |
5.44 |
5.44 |
5.66 |
5.54 |
|
New York |
6.31 |
5.79 |
5.79 |
6.07 |
5.95 |
|
Chicago |
5.88 |
5.39 |
5.42 |
5.69 |
5.56 |
|
Cal. Comp. Avg,* |
5.27 |
4.55 |
4.91 |
5.19 |
5.21 |
|
Futures ($/MMBtu) |
|
|
|
|
|
|
Jul delivery |
5.606 |
5.675 |
5.706 |
5.712 |
5.581 |
|
Aug delivery |
5.716 |
5.766 |
5.803 |
5.794 |
5.665 |
|
*Avg. of NGI's reported
avg. prices for: Malin, PG&E
citygate, |
|||||
|
and Southern California
Border Avg. |
|||||
|
Source: NGI's Daily Gas
Price Index (http://intelligencepress.com). |
|||||
In the NYMEX futures
market, price decreases for the near-month and second month contracts (for July
and August delivery) were four times the decreases of the previous week. A
likely contributing factor to these price declines was last Thursday’s EIA
report of a second record-high weekly stock increase. On that day, the July contract fell $0.603 per MMBtu to settle at
$5.606, the first sub-$6 settlement price since May 9. Continuing mild temperatures, coupled with
forecasts for more of the same in many high air-conditioning load markets, kept
futures price changes in a fairly narrow range until yesterday, when the near
month contract fell by over 13 cents, reportedly on the market’s expectation of
another unusually large storage injection.
As of the end of trading yesterday, the July contract stood at $5.581
per MMBtu, down $.632 from last Wednesday’s price, and down 94 cents from its
highest settlement as the near-month contract of $6.521 on Thursday, June 5.
|
Estimated Average Wellhead Prices |
||||||
|
|
Dec-02 |
Jan-03 |
Feb-03 |
Mar-03 |
Apr-03 |
May-03 |
|
Price ($ per Mcf) |
3.84 |
4.47 |
5.45 |
6.69 |
4.71 |
4.97 |
|
Price ($ per MMBtu) |
3.74 |
4.36 |
5.31 |
6.53 |
4.59 |
4.85 |
|
Note: The price data in this table are a pre-release of the average
wellhead price that will be published in forthcoming issues of the Natural
Gas Monthly. Prices were
converted from $ per Mcf to $ per MMBtu using an average heat content of 1,025
Btu per cubic foot as published in Table A2 of the Annual Energy Review
2001. |
||||||
|
Source: Energy Information Administration, Office
of Oil and Gas. |
||||||
Working gas in storage increased to 1,438 Bcf as of
Friday, June 13, which is just over 22 percent below the previous 5-year
(1998-2002) average, according to EIA’s Weekly Natural Gas Storage Report. The implied net change of 114 Bcf matched
the record-setting volume of two weeks prior, and was itself also a record for
this week. (See Storage Figure) East region
storage operators attained their highest net stock change thus far in the
refill season, with implied net injections of 72 Bcf. The East region’s stock build was 44 percent greater than the
5-year average, exceeding the average for the ninth week in a row. Implied net injections for the other two
regions and for the nation as a whole also exceeded their respective 5-year
averages for the week, ranging from 30 percent greater in the West to nearly 53
percent greater in the Producing region.
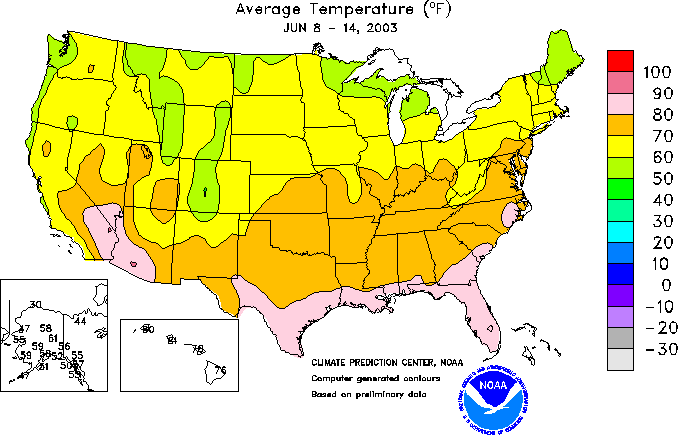
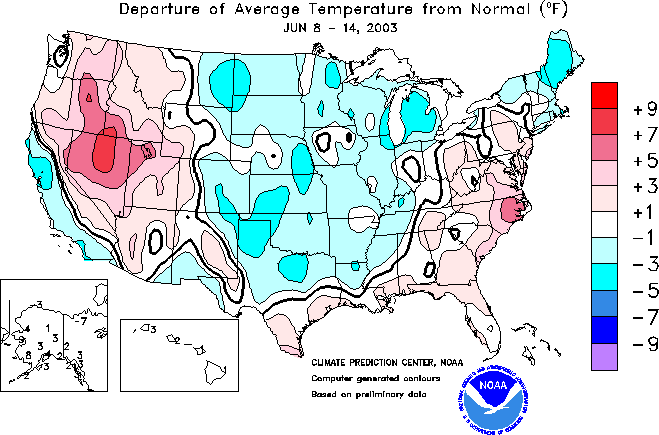
Injection activity in the East was facilitated by unusually mild weather
in the normally high gas-consuming Census Divisions of New England, Middle
Atlantic, and East North Central, where both cooling degree days (CDD) and
gas-customer weighted heating degree days (HDD) were well below normal for the
week. (See Temperature Map) (See Deviation Map). According
to the latest data from the National Weather Service, HDDs were below normal
for eight of the nine Census Divisions; for the United States as a whole, they
were 50 percent less than normal.
|
All Volumes
in Bcf |
Current
Stocks 6/13/03 |
Estimated
Prior 5-Year (1998-2002) Average |
Percent
Difference from 5 Year Average |
Implied Net
Change from Last Week |
One-Week
Prior Stocks 6/6/03 |
|
|
East Region |
769 |
998 |
-22.9% |
72 |
697 |
|
|
West Region |
254 |
256 |
-0.8% |
13 |
241 |
|
|
Producing
Region |
415 |
596 |
-30.4% |
29 |
386 |
|
|
Total Lower
48 |
1,438 |
1,850 |
-22.3% |
114 |
1,324 |
|
|
Source: Energy Information Administration: Form EIA-912, "Weekly Underground
Natural Gas Storage Report," and the Historical Weekly Storage Estimates
Database. Row and column sums may not
equal totals due to independent rounding.
|
||||||
Natural Gas Rig Counts: The number of rigs drilling
for natural gas climbed by 18 to 910 for the week ended June 13, according to
Baker-Hughes Incorporated. This is the highest rig count since the week ended
October 12, 2001. The number of natural gas rigs is over 28 percent greater
than last year at this time, and nearly 34 percent above the 5-year average for
the report week. The rig count has
climbed by nearly 26 percent in 2003, contrasting with last year’s decline of
more than 5 percent for the same 24-week period. The share of rigs drilling for
natural gas was 85 percent for the report week, remaining consistently above 80
percent since May 2001. This is the
longest period in the 15 years that Baker-Hughes has separately reported gas
and oil drilling rigs that rigs drilling for natural gas have comprised more
than 80 percent of total rigs drilling.
Moreover, this is the highest share of rigs drilling for natural gas
since September 2002. The emphasis on
gas prospects reflects a relative advantage in the economics of natural gas
prospects compared with domestic crude oil prospects.
Summary:
Spot
and futures prices declined significantly, marking the second straight week of
falling prices, as lower-than-normal heating and cooling degree days in most
major market areas kept weather-driven swing demand to a minimum. Working gas
storage inventories increased by more than 100 Bcf for the third week in a row.