
Overview: Thursday, January 16, 2003 (next release
2:00 p.m. on January 23)
Natural
gas spot prices have climbed 10 to 30 cents per MMBtu at most trading locations
since Wednesday, January 8. Strong space-heating demand in Northeast and
Midwest population centers boosted prices throughout much of the country, but
particularly where several interstate pipelines notified shippers of
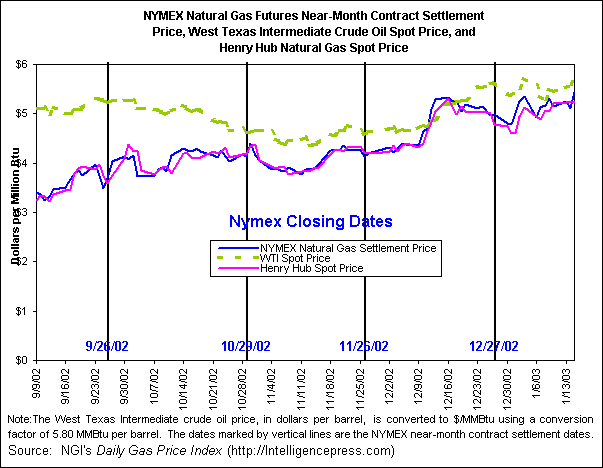
restrictions on their systems. On the week (Wednesday-Wednesday), the Henry Hub
spot price climbed 15 cents to an average of $5.22 per MMBtu, while the New
York citygate price registered a much steeper increase of $1.20 to an average
of $7.46. The NYMEX futures contract for February delivery gained just under 27
cents per MMBtu to a close of $5.43 on Wednesday, January 15. Natural gas in
storage as of Friday, January 10, decreased to 2,195 Bcf, which is 0.8 percent
below the 5-year (1998-2002) average. The spot price for West Texas
Intermediate (WTI) crude oil traded near two-year highs, rising $2.57 per
barrel on the week to yesterday’s closing price of $33.23 per barrel, or $5.29
per MMBtu.
Despite slight declines at many
trading locations yesterday (Wednesday, January 15), spot prices remained
strong throughout the country as an Arctic front brought the coldest weather of
the year to the East. The largest daily price change came last Friday, January
10, when prices along the Gulf Coast and other producing regions climbed 15 to
25 cents per MMBtu in response to forecasts of colder weather this week. As the
cold front moved closer to population centers, prices strengthened with the
Henry Hub average spot price on Tuesday reaching $5.25 per MMBtu, which was its
highest average since December 16. Despite a slight 3-cent decline to $5.22 per
MMBtu in trading yesterday, the Henry Hub spot price is more than double its
trading range of $2.20-$2.40 at this time last year. On the week, the average
price for Northeast trading locations increased about 56 cents to $6.99 per
MMBtu. Peak-day conditions on several
interstate pipelines resulted in significant variability at some markets.
Algonquin Gas Transmission notified shippers that imbalances on its pipeline of
greater than 2 percent could result in penalties, while Tennessee Gas Pipeline
informed shippers that the low temperatures could affect supplies into the
pipeline and further jeopardize system integrity. Prices for deliveries off
Tennessee and Algonquin have shown the greatest variability in the Northeast
region this week, rising on Tuesday to $8.85 and $8.87 per MMBtu before falling
62 and 78 cents, respectively, in yesterday’s trading. In contrast to
conditions in the East, market centers located in the Rockies and California
were relatively settled owing to mild temperatures over much of the region.
NYMEX futures settlement prices registered large
gains on the week after weather forecasts released yesterday (Wednesday,
January 15) predicted the cold temperatures will last until at least the end of
the month. The futures contract for February delivery jumped just over 32
cents, or 6 percent, to a close of $5.43 per MMBtu. On the week, the near-month
contract gained just under 27 cents. At its closing on Wednesday, the February
contract price is the highest for a near-month contract since April 2001, when
futures prices were descending from high levels in the winter of 2000-2001. The
12-month strip, which is an average of the monthly futures prices for the
coming year, settled at $5.006 per MMBtu, the first time it has risen above $5
this winter.
|
Spot Prices ($ per MMBtu) |
Thur. |
Fri. |
Mon. |
Tues. |
Wed. |
|
9-Jan |
10-Jan |
13-Jan |
14-Jan |
15-Jan |
|
|
Henry Hub |
5.05 |
5.21 |
5.22 |
5.25 |
5.22 |
|
New York |
6.79 |
7.52 |
7.86 |
7.81 |
7.46 |
|
Chicago |
4.98 |
5.12 |
5.14 |
5.18 |
5.16 |
|
Cal. Comp. Avg,* |
4.53 |
4.64 |
4.64 |
4.69 |
4.67 |
|
Futures ($/MMBtu) |
|
|
|
|
|
|
Feb delivery |
5.304 |
5.143 |
5.251 |
5.107 |
5.430 |
|
Mar delivery |
5.229 |
5.068 |
5.172 |
5.055 |
5.355 |
|
*Avg. of NGI's reported
avg. prices for: Malin, PG&E
citygate, |
|||||
|
and Southern California
Border Avg. |
|||||
|
Source: NGI's Daily Gas
Price Index (http://intelligencepress.com). |
|||||
Working gas in storage was 2,195 Bcf or 0.8 percent
below the 5-year average for the week ending January 10, according to EIA’s Weekly Natural Gas Storage Report (See Storage Figure).
The implied net withdrawal was 136 Bcf, which is 16 Bcf more than the five-year
average withdrawal for the week but 6 Bcf lower than the 142 Bcf pulled from
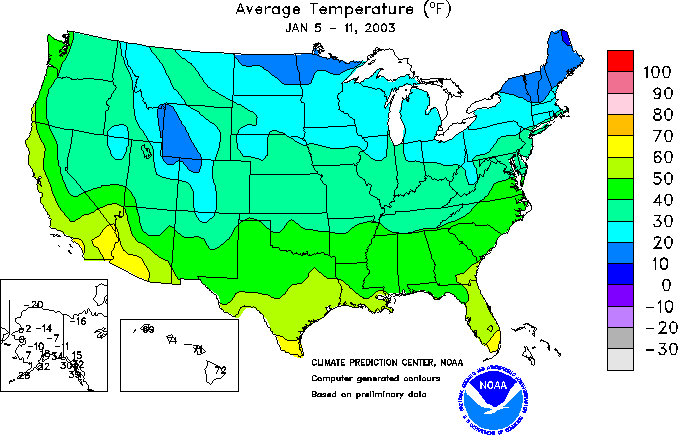
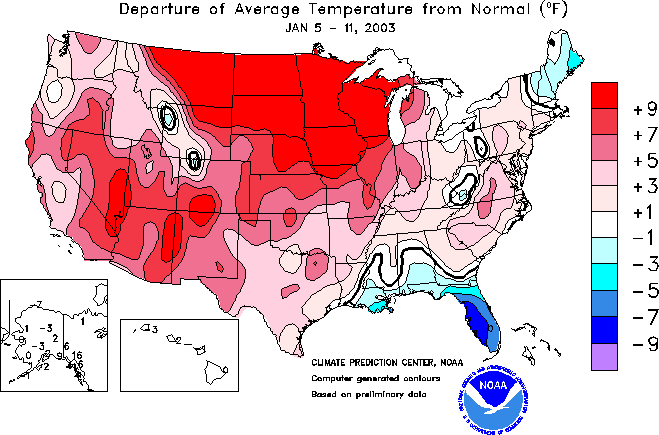
underground storage last year. Across the country, the weather was about 21
percent warmer than normal during the week ending
January 11 as measured by heating degree days (HDDs) adjusted for the
population with natural gas space heating, according to the National Weather
Service. (See Temperature Map) (See Deviation Map.) In the heavily populated New England and
Middle Atlantic regions, HDDs were, respectively, 7 and 9 percent lower than normal. Despite the
warmer-than-normal temperatures, the net withdrawal was the third highest of
this winter season and is significantly higher than last week’s withdrawal of
86 Bcf.
|
All Volumes
in Bcf |
Current
Stocks 1/10/03 |
Estimated
Prior 5-Year (1997-2002) Average |
Percent
Difference from 5 Year Average |
Implied Net
Change from Last Week |
One-Week
Prior Stocks 1/3/03 |
|
|
East Region |
1,248 |
1,336 |
-6.6% |
-85 |
1,333 |
|
|
West Region |
329 |
280 |
17.5% |
-13 |
342 |
|
|
Producing
Region |
618 |
596 |
3.7% |
-38 |
656 |
|
|
Total Lower
48 |
2,195 |
2,213 |
-0.8% |
-136 |
2,331 |
|
|
Source: Energy Information Administration: Form EIA-912, "Weekly Underground
Natural Gas Storage Report," and the Historical Weekly Storage Estimates
Database. Row and column sums may not
equal totals due to independent rounding. |
||||||
FERC Examines Standards For Natural Gas Price-Reporting: Federal Energy Regulatory Commission (FERC) staff raised the issue of
questionable price indices in a discussion paper presented to the Commission
during its regular weekly meeting yesterday (Wednesday, January 15). Staff asserted that the recent admissions by
a number of marketing companies that employees had provided false price
information to various industry publications raises doubts about the accuracy
of gas prices published by these industry organizations. The FERC staff recommended
that the Commission develop minimum price index standards that would have to be
met before any set of prices could be used in new pipeline tariffs. Currently, published prices from various
industry sources (e.g. Natural Gas Intelligence, Inside FERC) are used
for pipelines’ cash-out and penalty tariff provisions, and are often referenced
in negotiated transportation contracts.
In a larger context, staff pointed out that these published price
indices are the basis for many physical and financial transactions throughout
the industry, and are “central to the functioning of wholesale natural gas
markets.” The staff recommended four
standards for price indices: (1)
accuracy, (2) adequacy of coverage, (3) market liquidity information, and (4)
verifiability. The Commission took no specific action at yesterday’s meeting,
but indicated that a technical conference would be arranged in the
“not-too-distant future.”
Summary:
Natural gas spot and futures
prices registered further gains as a blast of Arctic cold arrived in many
regions of the country and weather forecasts indicated colder temperatures are
here to stay until at least the end of the month. Natural gas in storage
declined to 2,195 Bcf with implied net withdrawals for the week ending January
10 totaling 136 Bcf. Although withdrawals were higher than the five-year
average for the week, inventories remain less than 1 percent below the
five-year average.
Natural
Gas Summary from the Short-Term Energy Outlook