
| xxxxx |
| Home > Natural Gas > Natural Gas Weekly Update |
|
Overview: Tuesday February,
19, 2002 Spot prices at many market
locations finished the week on Friday, February 15 with sharp decreases that
reversed most of the gains from earlier in the week.� The� price at the Henry Hub
was $2.18, a decline of 2 cents per MMBtu compared with the previous
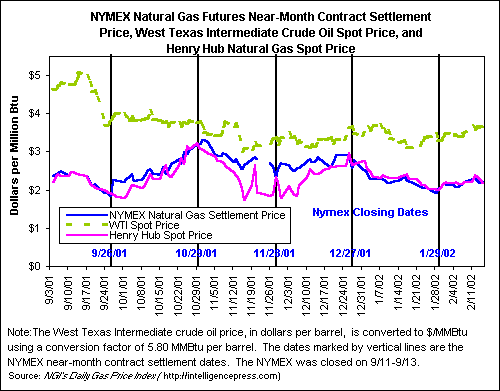
Friday.� On the NYMEX, the price of the
futures contract for March delivery at the Henry Hub settled at $2.206 per
MMBtu, roughly 2 cents greater than� the
previous Friday.� A trend towards
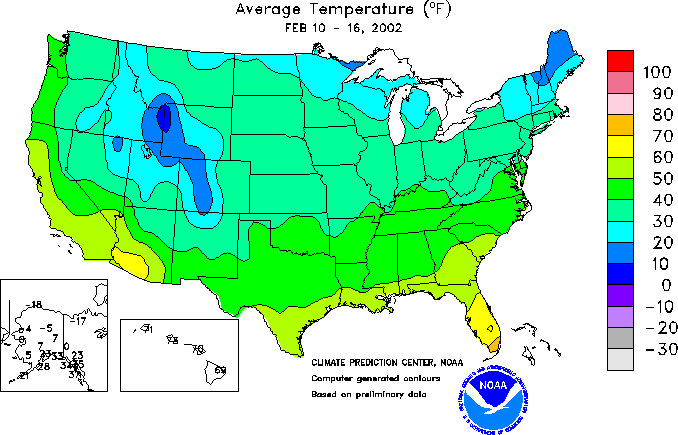
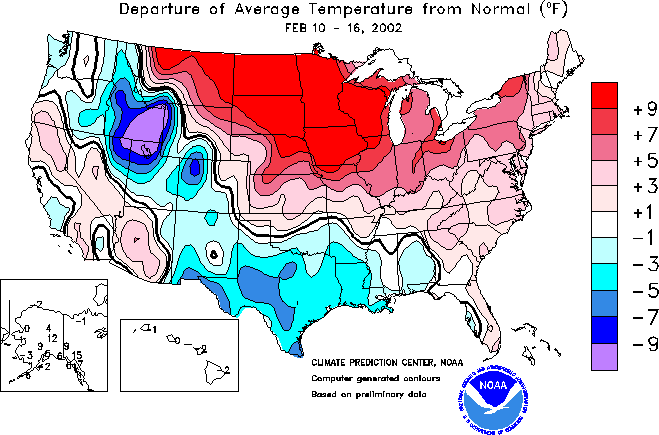
cooling temperatures across most of the country may have contributed to the
rally in prices early in the week. (See
Temperature Map) (See Deviation Map)� However, expectations of warmer temperatures early this week and
lighter demand over the holiday weekend along with unusually high storage
levels likely reversed the price rally.�
The spot price for West Texas Intermediate (WTI) crude oil increased by
roughly 6 percent, climbing to $21.47 per barrel or $3.70 per MMBtu.
Prices: In a
week of heightened variability, spot prices gained between 15 and 51 cents per
MMBtu early in the week, before declining beginning at mid-week.� Expectations of mild temperatures next week
and light demand heading into the holiday weekend resulted in price declines of
up to 13 cents on Friday at market locations across the country.� Despite the relatively large price movements
during the week, prices generally ended the week only slightly changed from the
previous Friday.� Spot prices at the New
York citygate exhibited the most variability climbing 51 cents to peak at $3.10
per MMBtu on Tuesday before declining throughout the remainder of the week to
close at $2.56 on Friday, February 15, 4 cents above the previous Friday.� When adjusted for inflation, prices at the
selected market locations in the table have remained close to the monthly
2-year average from 1998 through 1999 (prior to the price spikes of 2000-2001)
in each month of the current heating season.�
At the
NYMEX, the settlement price of the futures contract for March delivery at the
Henry Hub also climbed early in the week, peaking on Tuesday, February 12 at
$2.305, before declining to end the week at $2.206 per MMBtu, just $0.015 or� less than 1 percent greater than the
previous Friday.� The settlement price
of the March contract varied in a fairly tight range of only about� plus or minus 5 cents per MMBtu.�
Storage: The total net withdrawal from storage for the week
ended Friday, February 8 was an estimated 156 Bcf, according to the American
Gas Association (AGA).� This is the second
largest weekly stock draw thus far this heating season, behind the 190 Bcf
withdrawn during the first week of this year.�
The high drawdown occurred during a week in which gas-weighted heating
degree days exceeded normal for the week by up to 10 percent in four of nine
Census Divisions according to National Weather Service data.� This drawdown exceeded this week�s average
over the previous 5 years (1997-2001) by 67 percent, although, over the 9-year
span of AGA data, it is exactly in the middle, with four larger and four
smaller withdrawals during this week.�
The estimated withdrawals in all three regions exceeded their respective
5-year averages by significant amounts:�
by about 43 percent in the East and 53 percent in the West.� Withdrawals of 44 Bcf in the Producing
region were nearly three times the 5-year average of 16 Bcf and the third
highest for this region over the 9 years of AGA data.� As of February 8, estimated cumulative net withdrawals for the
heating season passed 1 Tcf, a milestone usually reached from two to six weeks
earlier in the season.� Total stocks as
of February 8 stood at an EIA-estimated 2,132 Bcf�nearly 37 percent above the
5-year average.
Other Market Trends: The Successor to �EnronOnline� Initiates
Activity.� On Monday, February 11, UBS
Warburg Energy announced the launch of its incarnation of EnronOnline, called
UBSWenergy.com.� UBS Warburg, the
investment-banking group of UBS AG, one of the largest financial services firms
in the world, was the successful bidder for the exclusive rights to the
technology that drove Enron�s North American wholesale electricity and natural
gas trading unit.� That technology,
together with reportedly over 600 former Enron employees�including the former
President and Chief Operating Officer�who built Enron�s trading operation into
the industry leader, now comprise the core of UBS Warburg Energy.� UBS Warburg Energy hopes to build a
successful trading operation, in part by recapturing trading business lost by
Enron to other trading platforms.� On
balance, Enron�s demise has had few apparent negative consequences to date on
natural gas market performance.�
However, an additional trading exchange would likely support added
competition and liquidity in wholesale trading.����� Producer Price Indexes─January 2002.� The Bureau of Labor Statistics just released its latest Producer
Price Index (PPI) estimates on Friday, February 15, which show either price
increases or slower decline rates for natural gas prices at various stages from
production to end-use consumption. At the upstream stage of �Crude Materials
for Further Processing,� the PPI (unadjusted) for natural gas increased by 4.9
percent in January�a sharp reversal from the 24.7 percent decrease recorded in
December 2001. For the overall category of�
�Intermediate energy goods,� price index movements were varied.� In this category, the PPI (seasonally adjusted,
unless otherwise stated) for natural gas to electric utilities dropped 0.9
percent in January after falling 4.8 percent in December.� Also in this category, the PPI for
industrial natural gas use actually rose by 2.7 percent in January,� after a 4.0 percent decline in December.
Finally, in the category of �Finished Consumer Goods Excluding Foods,�
residential gas increased by 1.7 percent in January, after dropping 3.2 percent
in December. Summary: Spot prices generally
finished the week on Friday, February 15, with only small changes from the
previous Friday.� On the NYMEX, the
settlement price of the futures contract for March delivery at the Henry Hub
settled at $2.206 per MMBtu, roughly 2 cents greater than the previous
Friday.� Net withdrawals of natural gas
from storage were 156 Bcf for the week ended February 8 in response to
larger-than-normal heating demand. � | ||||||||||||||||||||||||||||||||||||||||||||||||||||||||||||||||||||||||||||||||||||||||||||||||||||||||||||||
| http://tonto.eia.doe.gov/oog/info/ngw/ngupdate.asp | ||||||||||||||||||||||||||||||||||||||||||||||||||||||||||||||||||||||||||||||||||||||||||||||||||||||||||||||
phone: 202-586-8800 email: infoctr@eia.doe.gov Specialized Services from NEIC |
||||||||||||||||||||||||||||||||||||||||||||||||||||||||||||||||||||||||||||||||||||||||||||||||||||||||||||||
|
phone: 202-586-8959 email: wmaster@eia.doe.gov |
||||||||||||||||||||||||||||||||||||||||||||||||||||||||||||||||||||||||||||||||||||||||||||||||||||||||||||||
|
|
||||||||||||||||||||||||||||||||||||||||||||||||||||||||||||||||||||||||||||||||||||||||||||||||||||||||||||||
|
|
||||||||||||||||||||||||||||||||||||||||||||||||||||||||||||||||||||||||||||||||||||||||||||||||||||||||||||||
|
|
||||||||||||||||||||||||||||||||||||||||||||||||||||||||||||||||||||||||||||||||||||||||||||||||||||||||||||||
| . | ||||||||||||||||||||||||||||||||||||||||||||||||||||||||||||||||||||||||||||||||||||||||||||||||||||||||||||||
| Renewables | Alternative Fuels | Prices | States | International | Country Analysis Briefs | ||||||||||||||||||||||||||||||||||||||||||||||||||||||||||||||||||||||||||||||||||||||||||||||||||||||||||||||
| Environment | Analyses | Forecasts | Processes | Sectors | ||||||||||||||||||||||||||||||||||||||||||||||||||||||||||||||||||||||||||||||||||||||||||||||||||||||||||||||