Overview
Lower prices and a report of
another considerable net injection to stocks were featured in last week�s gas
markets. As of Friday, May 11, 2001, the spot price of natural gas at the Henry
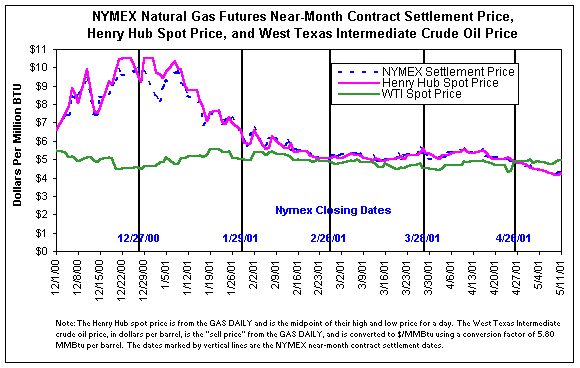
Hub dropped $0.24 from the previous Friday to $4.25 per MMBtu.� The NYMEX price of natural gas for June
delivery at the Henry Hub declined $0.212 for the week to $4.278 per
MMBtu.� A record-setting 108 Bcf was
added to natural gas stocks for the week ended May 4, 2001. The demand for
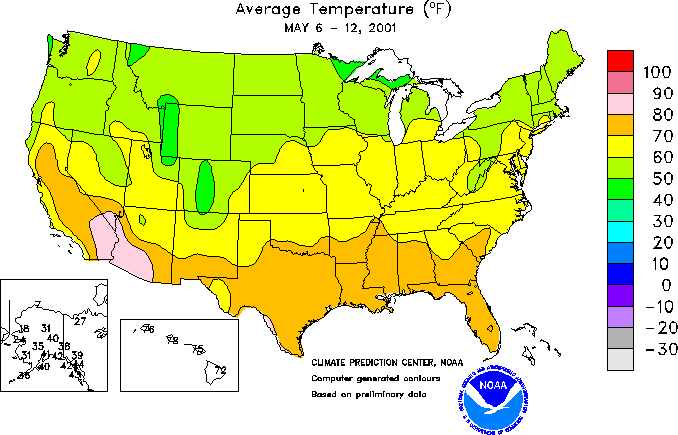
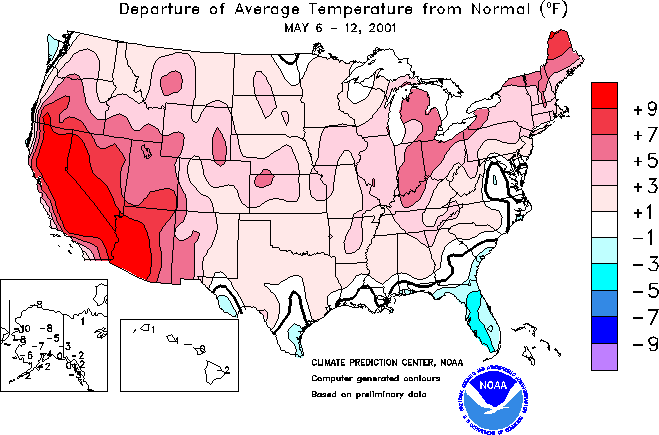
cooling is still somewhat limited as mild temperatures prevailed around most of
the country. (See Temperature Map) (See Deviation from Normal Temperatures Map)
Prices
Mid-week prices were at the
lowest level since early August. Even with an end-of-the-week influence from
the futures market that caused a slight upturn, spot prices at the major supply
hubs were $0.25 to $0.65 cents per MMBtu lower on a week-to-week basis with
Katy, Texas ending at $4.23; the Henry Hub, Louisiana at $4.25; Midcon,
Oklahoma at $4.11; and Opal, Wyoming at $3.30. Prices at the Chicago and New
York citygates were lower as well, registering $4.35 and $4.65 at week�s end, off
a respective $0.27 and $0.20 per MMBtu for the week.� SoCal provided the only exception to the generally lower trend as
demand increased because of warmer temperatures.� Natural gas prices receded before temperatures did, though.� The effect of unscheduled maintenance on the
PG&E Gas Transmission system was imperceptible to PG&E�s large-volume
purchasers.� By Friday, the PG&E
customers were paying $3.51 less at $4.18 while SoCal�s citygate price was only
$0.47 lower at $11.92.
On the NYMEX futures market,
the price for the near-month (June) contract was generally lower even after
some position-covering the last two days of the week.� The June contract ended the week at $4.278 per MMBtu, down $0.212
from the previous Friday and $0.589 below the opening prices as the near-month
contract on April 27.� All forward
months were down by comparable amounts with prices ranging from a low of $4.350
in July to a high of $4.797 in January.�
These prices are expected to induce further injections to storage since
prices for a future month delivery exceed the preceding month by the 2 to 3
cents per MMBtu required to cover monthly storage costs.
|
Spot Prices ($ per MMBTU)-Selected
Trading Centers
|
Mon. 5/7
|
Tues. 5/8
|
Wed. 5/9
|
Thur. 5/10
|
Fri.��
5/11
|
|
Henry Hub
|
4.32
|
4.23
|
4.15
|
4.17
|
4.25
|
|
New York citygates
|
4.69
|
4.61
|
4.52
|
4.65
|
4.65
|
|
Chicago citygates
|
4.44
|
4.35
|
4.23
|
4.25
|
4.35
|
|
Southern CA (SOCAL)
|
12.73
|
12.57
|
12.43
|
12.34
|
11.92
|
|
Futures (Daily
Settlement, $MMBTU)
|
|
|
|
|
|
|
Near-Month (June)
|
4.239
|
4.279
|
4.202
|
4.348
|
4.278
|
|
July
|
4.314
|
4.353
|
4.273
|
4.414
|
4.350
|
|
Source: Financial Time
Energy, Gas Daily
|
Storage
Net
injections reported by the American Gas Association of 108 Bcf for the 7-day
period ending May 4, 2001, were by far the largest total for the week in the
8-year history of the data.� Previously,
net additions have been as low as 46 Bcf (1997) and as high as 82 Bcf (1994)
for the week with a 6-year (1995-2000) average of 59 Bcf.� All regions reported a record fill with the
West region exceeding its average injection rate of 7 Bcf by 100 percent.� The East and Producing regions were 68
percent and 81 percent above their respective averages of 35 Bcf and 19
Bcf.�� With net storage injections for
April estimated at 267 Bcf, this year�s refill season (April through October)
is off to its best start in the 25 years that EIA has collected these data.
|
All Volumes
in BCF
|
Current
Stocks (Fri, 5/4)
|
Estimated
6-Year (1995-2000) Average
|
Percent
Difference from 6 Year Average
|
Net Change
from Last Week
|
One-Week
Prior Stocks (Fri, 4/27)
|
|
|
East Region
|
554
|
643
|
-13.9%
|
60
|
494
|
|
|
West Region
|
172
|
213
|
-19.1%
|
14
|
158
|
|
|
Producing Region
|
337
|
412
|
-18.1%
|
34
|
303
|
|
|
Total Lower 48
|
1063
|
1,268
|
-16.2%
|
108
|
955
|
|
|
Note:� net change data are estimates published by
AGA on Wednesday of each week.� All stock-level
Figures are EIA estimates based on EIA monthly survey data and weekly AGA
net-change estimates.� Column sums may
differ from Totals because of independent rounding.�
|
|
|
|
|
Other Market Trends
Reports of possible fuel switching have circulated
as the price of natural gas has declined and the price of crude oil has
stabilized in the $26 to $28 per barrel range, closing at $26.60 ($4.93 per
MMBtu) on May 11.� As an illustration of
this differential, the spot prices for No. 2 heating oil on the U.S. Gulf Coast
and the New York Harbor was the equivalent of $5.36 and $5.48 per MMBtu,
respectively, according to Reuters News
Service.� The comparable prices for
natural gas were $4.25 (Henry Hub, Louisiana) and $4.65 (New York
citygates).� According to the same
source, the price for low sulfur No. 6 residual fuel, another natural gas
alternative, is now just 40 cents lower than natural gas in New York City.
Summary
Another record-setting
injection to storage was reported last week as suppliers took advantage of
lower prices, particularly in comparison to expected future prices.� However, higher demand resulting from the
onset of the cooling season and from fuel switching may slow the pace of
injections and price declines in the near future.
