Year in Review: Crude Oil Prices 2014
Release date: April 28, 2015
Background
In 2014, Brent front month crude oil futures prices fell from $108 per barrel on January 2 to $57 per barrel on December 31. This report gives an overview of the primary drivers of crude oil price movements in 2014, in particular the substantial price decline that took place during the second half of the year. Factors such as increased global supply of crude oil, lower crude oil supply disruptions, lower economic growth expectations, and currency exchange rate movements are explored in the report. In addition, links are provided to several other published EIA articles with further in-depth discussion of topics related to the oil price decline.
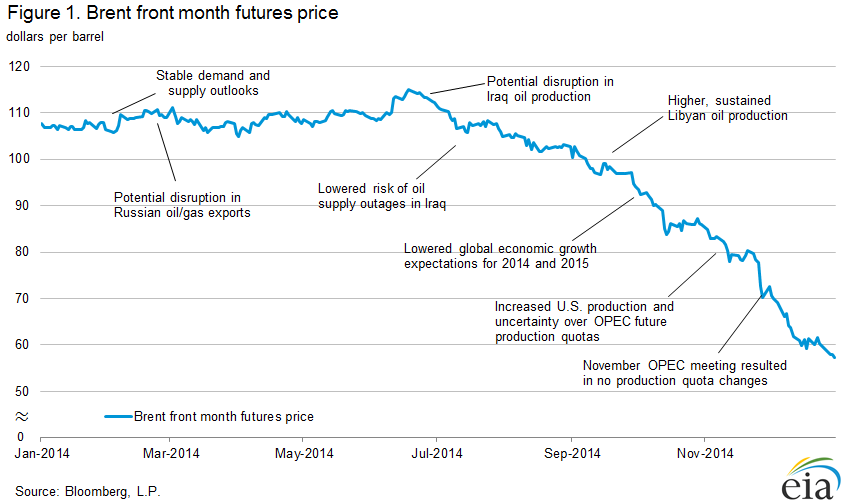
After trading in a relatively narrow $10 per barrel range for the first six months of the year and reaching its peak of $115.06 per barrel on June 19, the Brent front month futures price fell sharply and settled at $57.33 per barrel on December 31, its lowest level of the year (Figure 1). Weakening global demand, combined with robust supply from rising U.S. production, decreasing supply disruptions, and the Organization of the Petroleum Exporting Countries (OPEC) maintaining production levels, were the primary causes for the 50% drop in crude oil prices in the second half of 2014.
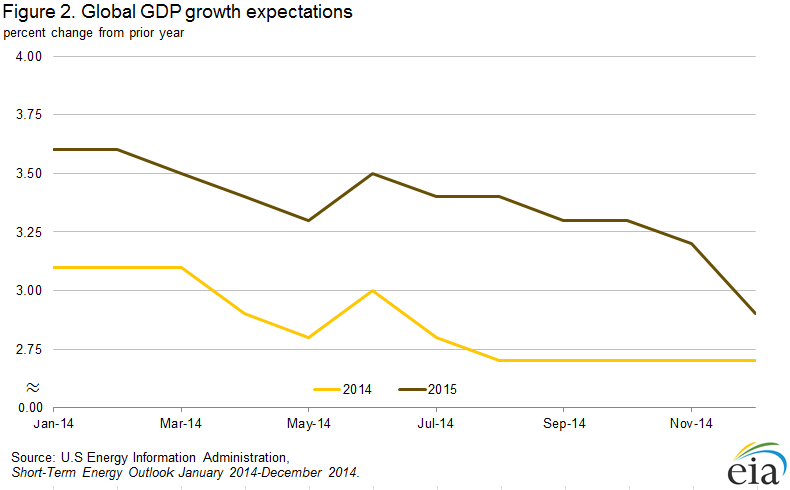
Global gross domestic product (GDP) growth expectations for both 2014 and 2015 declined through the year. Using the 2015 world GDP growth projections published in the Short-Term Energy Outlook (STEO) each month in 2014, expectations for global economic growth dropped below 3% in December after starting 2014 above 3.5% (Figure 2). As a result, projections for future global oil consumption were scaled back, putting downward pressure on crude oil prices. The risk of additional downward revisions to future economic growth, a driver of petroleum product consumption growth, is one of the primary factors that could lead to further crude oil price declines.
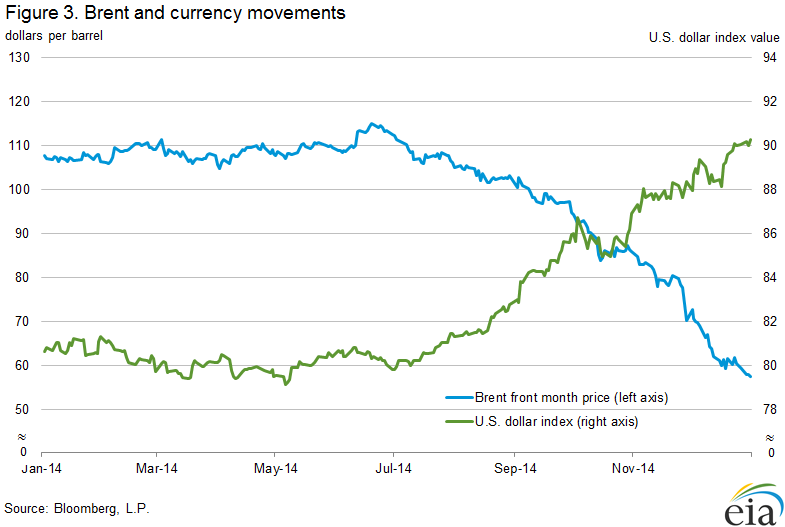
The lower economic growth expectations were mostly driven by lower-than-expected economic data outside the United States. The dynamic of robust domestic economic growth and disappointing global economic growth is reflected in the movement of the U.S. dollar. The U.S. dollar index strengthened by 13% from July 1 to December 31, concurrent with the decline in oil prices (Figure 3).
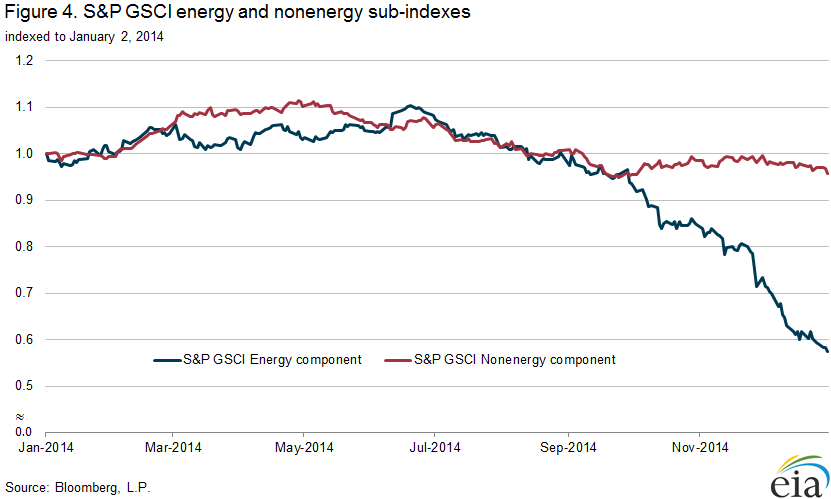
From July to September, crude oil was not the only commodity that experienced price declines. Both the Standard & Poor's Goldman Sachs Commodity Index (S&P GSCI) energy and nonenergy sub-indexes declined in value by a similar amount during that period (Figure 4), indicating that concerns stemming from demand, rather than supply, weighed on crude oil prices. News of weak economic growth in countries like China, Brazil, and India during second and third quarters of 2014 affected the price of energy and nonenergy commodities alike.
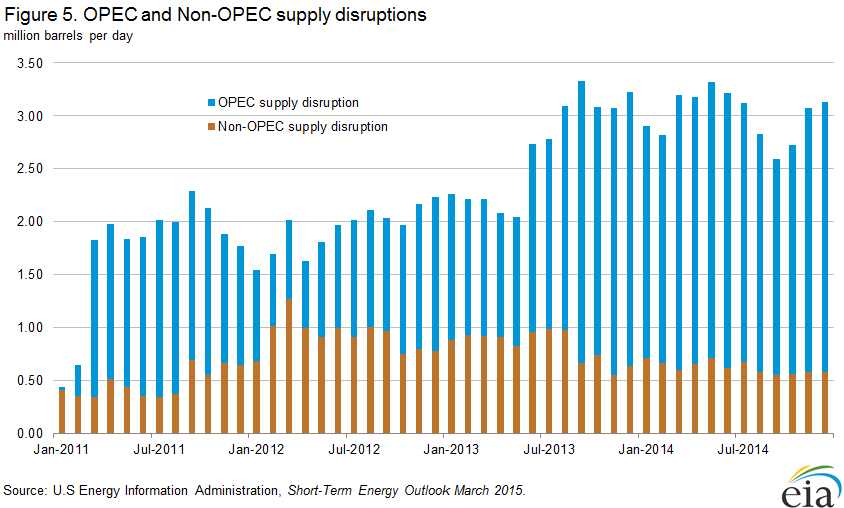
In 2014, crude oil prices peaked in June primarily because of news of internal conflict in Iraq. Concerns about disruptions to Iraqi crude oil production soon abated as it seemed unlikely that crude oil production in the southern part of the country would be affected or taken offline. Actual OPEC crude oil production disruptions fell from 2.6 million barrels per day in May to 2.0 million barrels per day in September (Figure 5). Fewer OPEC supply disruptions allowed more oil to enter the global market and lowered oil prices during the third quarter of 2014.
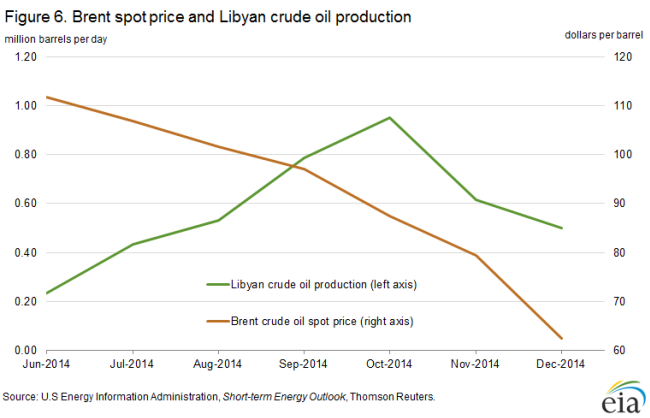
Since the summer of 2013, the price of crude oil included a risk premium that reflected the sharp, sudden decline in Libyan crude oil production and subsequent uncertainty in the stability of any given production level. However, during the summer of 2014, Libyan production rose steadily to 0.95 million barrels per day in October (Figure 6), exceeding market expectations. Higher, sustained production levels in Libya during that period put downward pressure on crude oil prices.
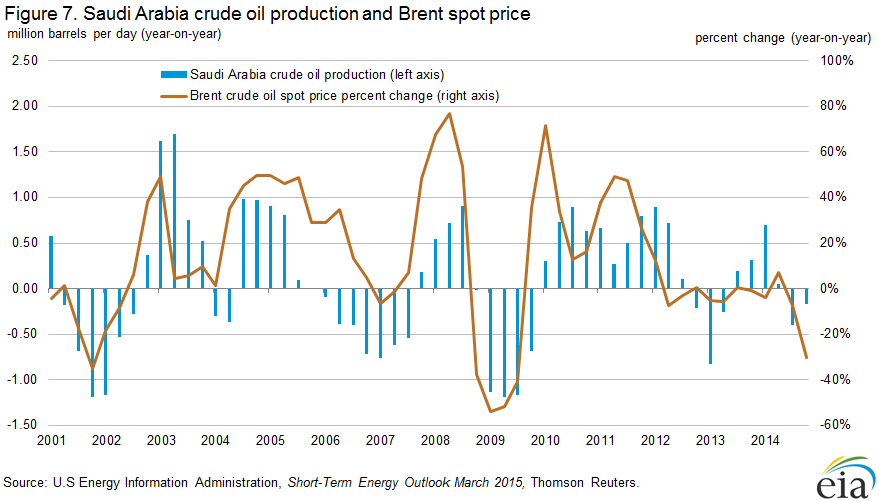
Due to available spare capacity and demonstrated historical willingness to cut production, Saudi Arabia is often seen as a swing producer—able to increase production during supply outages and decrease production in times of rising global supply. During previous crude oil price declines, Saudi Arabia typically lowered its crude oil production levels to allow prices to stabilize and eventually rise. However, in the third and fourth quarters of 2014, Saudi Arabia did not reduce production levels to the same extent as the country has in the past during similar declines in crude oil prices (Figure 7). Further, no changes were made to the overall OPEC production quota levels in the semi-annual OPEC meeting on November 27, 2014. The perception that Saudi Arabia, instead of trying to stabilize prices, was going to defend market share led to further declines in crude oil prices.
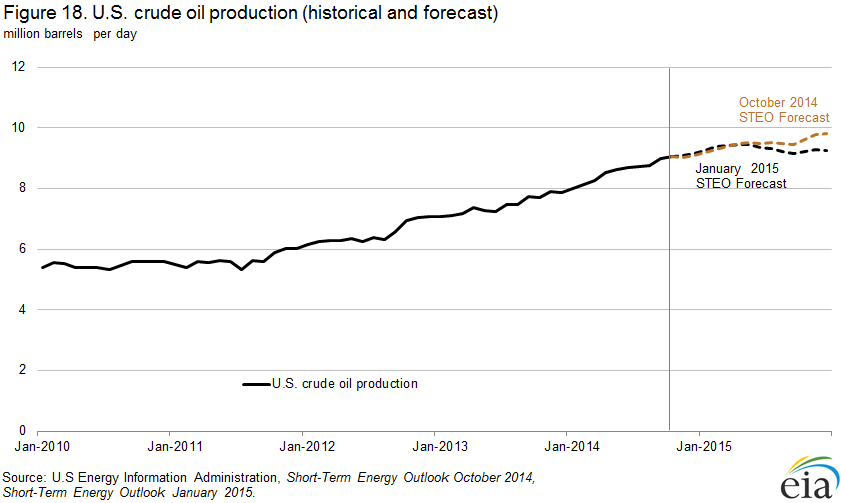
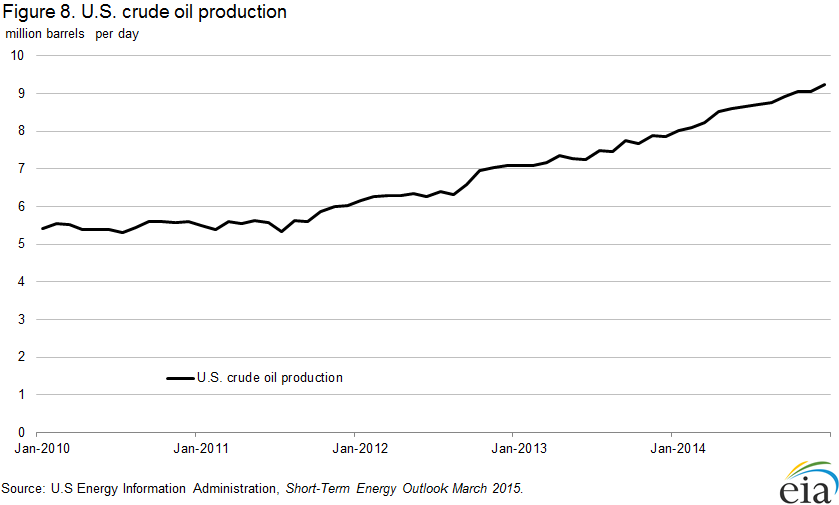
U.S. crude oil production reached 9 million barrels per day in October 2014, a 1 million barrel per day rise from January 2014 (Figure 8). The rate of increase in production was higher than forecasted at the beginning of 2014. In the January 2014 STEO, U.S. crude oil production was projected to be only 8.8 million barrels per day in October 2014 and to not reach 9 million barrels per day until 2015. The United States required fewer crude oil imports as a result of increased domestic production.
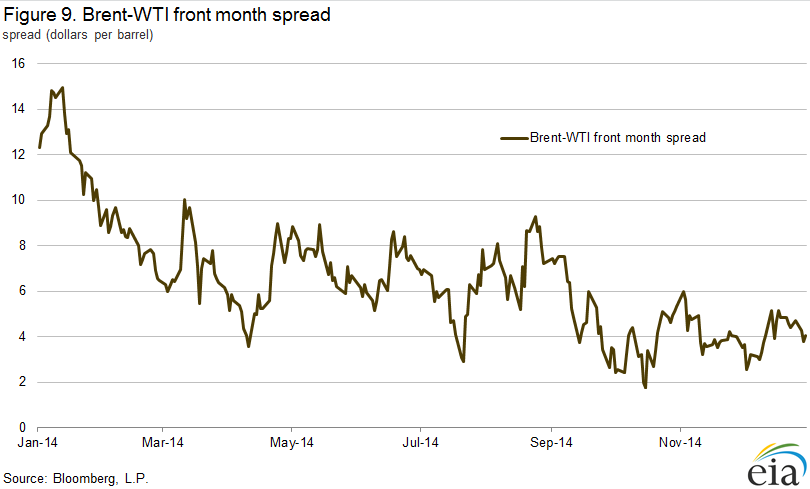
The Brent-WTI spread declined in 2014 as new transportation infrastructure came online and reduced costs associated with moving WTI crude oil from Cushing to the Gulf Coast (Figure 9). The opening of the 700 thousand barrel per day Marketlink pipeline in January as well as record high utilization rates from refineries in Petroleum Administration for Defense Districts (PADDs) 2 and 3 contributed to a narrowing of the Brent-WTI spread. Weakening demand-side factors—such as economic slowdown in Europe, Japan, and emerging markets—also put further strain on the waterborne crude oil market compared to the U.S. midcontinent market, where refining margins were high. U.S. consumption of petroleum products increased in 2014 over 2013 levels, which also contributed to greater support for the WTI market than the Brent market. The Brent market also was depressed from continued import reductions in the United States and the return of Libyan supply into the Atlantic basin market.
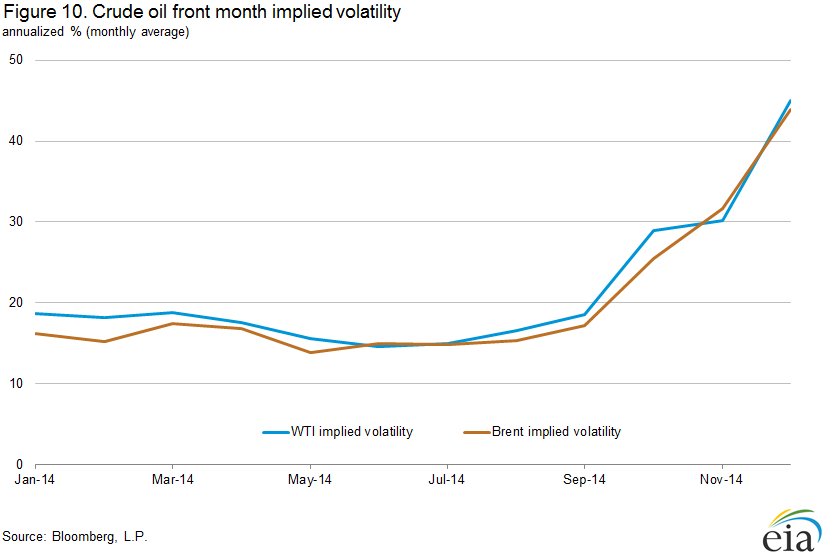
Implied volatility spent much of the first half of 2014 near multi-year lows but rose steadily through the end of the year, reflecting heightened uncertainty in the market over future consumption and at what price production increases would slow sufficiently to balance markets. Monthly averages for both Brent and WTI implied volatility reached 44% and 45%, respectively, in December (Figure 10), and marked the highest level since the first Libyan supply outage in April 2011.
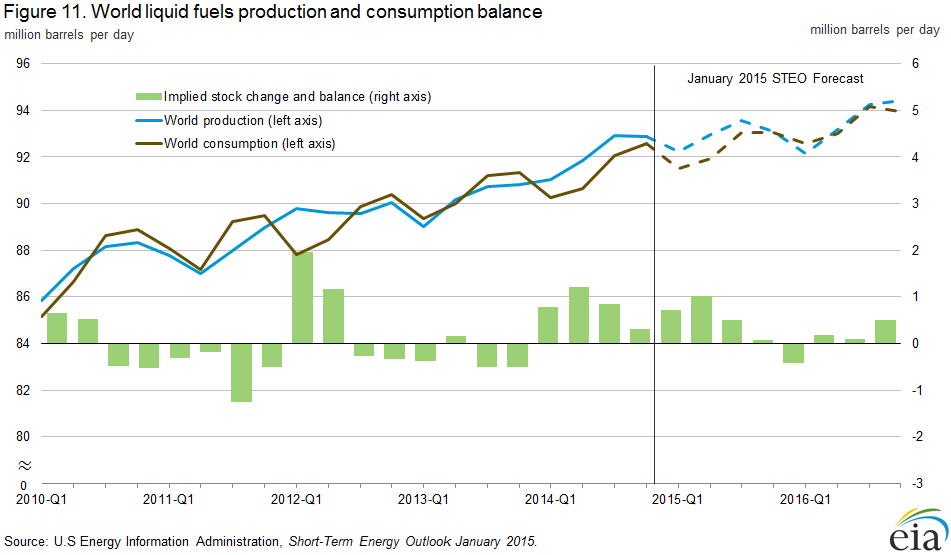
An increasing imbalance between supply and demand led to rising global inventories and expectations of continuing growth in global inventories (Figure 11). Libyan production, along with a slowdown in the European economy, loosened the Atlantic-basin market in late July. Combined with a recession in Japan, slower growth in emerging markets, robust growth in non-OPEC supply, and the absence of a production response from Saudi Arabia, supply outpaced demand in the second half of 2014. Production typically takes some time to respond to lower prices, as sunk costs and movements into more productive areas of fields reduce any immediate change in the current level of production. The January 2015 STEO projects these imbalances to remain until the fourth quarter of 2015, when the supply response to low prices and demand increases in the second half of the year bring the market back into balance.
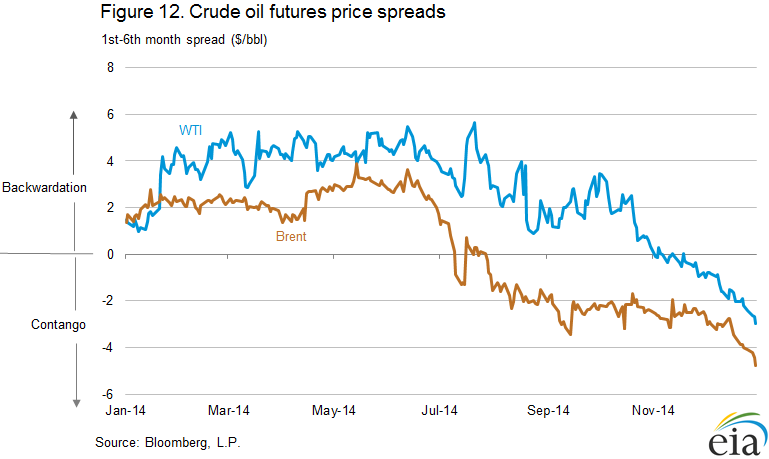
The Brent crude oil futures curves reflected the loosening of the market and rising global crude oil inventories, with the 1st-6th futures price spread moving into contango in August (Figure 12). Contango reached the steepest level since 2009, when the financial crisis led to a significant drop in demand, thereby increasing crude oil storage. The upward sloping futures curve provides a signal that the current market is amply supplied and that the crude oil should be stored for future consumption. It also signals less of a risk premium in near-term prices because of a reduction in the expected price response to potential supply outages.
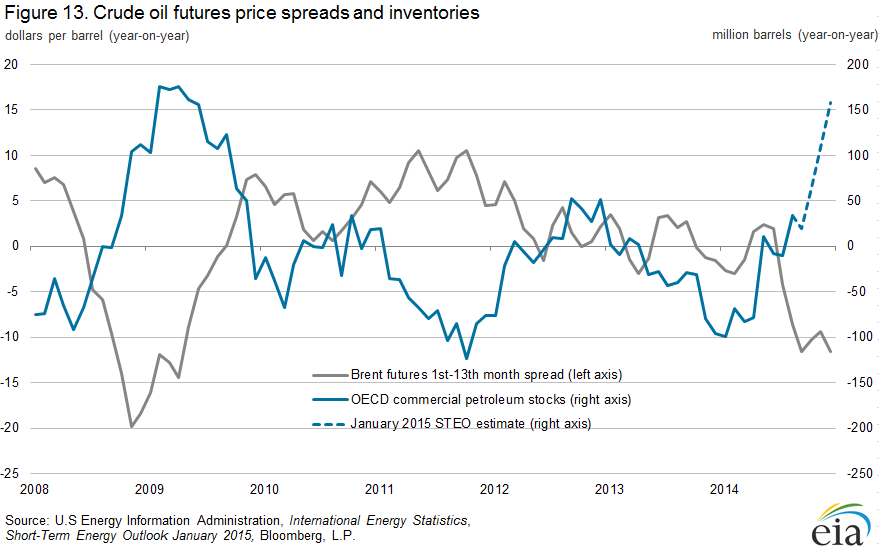
In addition, inventories in the Organization for Economic Co-operation and Development (OECD) countries began to show year-on-year increases, applying further downward pressure on near-term prices (Figure 13). Increases in oil inventory tend to increase storage costs, which can contribute to declines in near-term prices compared to prices for future delivery. Recent OECD inventory data show signs of building, and U.S. inventories built counter-seasonally in December. The January 2015 STEO estimates that OECD inventories had the largest year-over-year builds since 2009, suggesting a similar market looseness that developed after the financial crisis in first-quarter 2009.
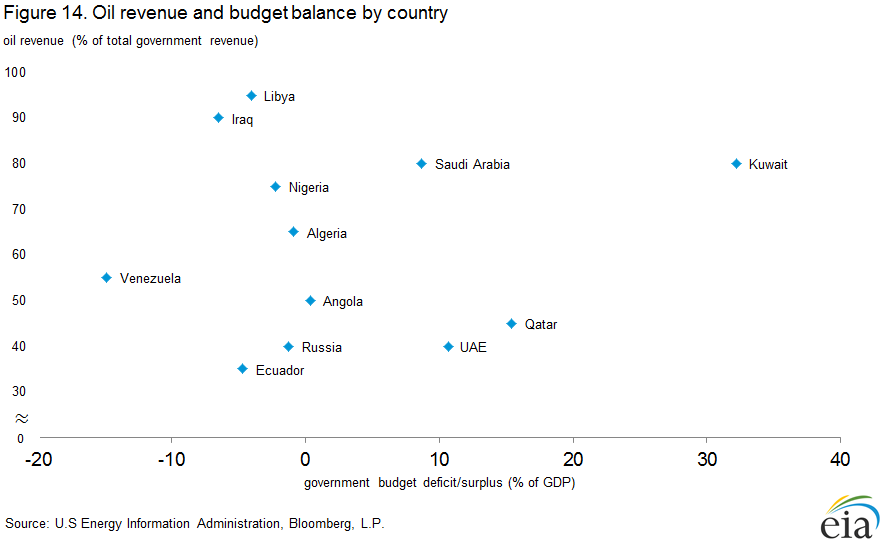
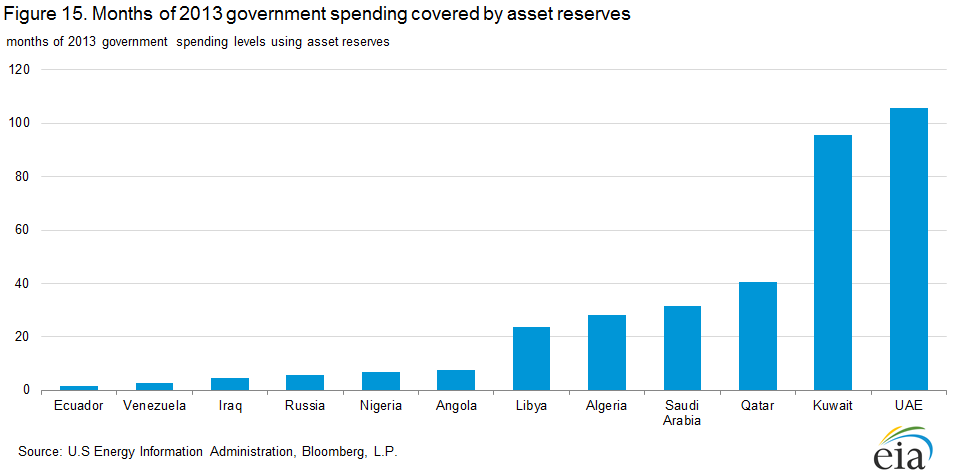
OPEC oil export income is projected to decline sharply in 2015 and to be well below previous years. The decline in oil prices affects OPEC member countries differently because some are able to weather a low price environment better than others. Countries with a higher reliance on oil revenues (Figure 14), relatively small sovereign wealth funds (Figure 15), and those already running government budget deficits are more at risk for government and social instability.
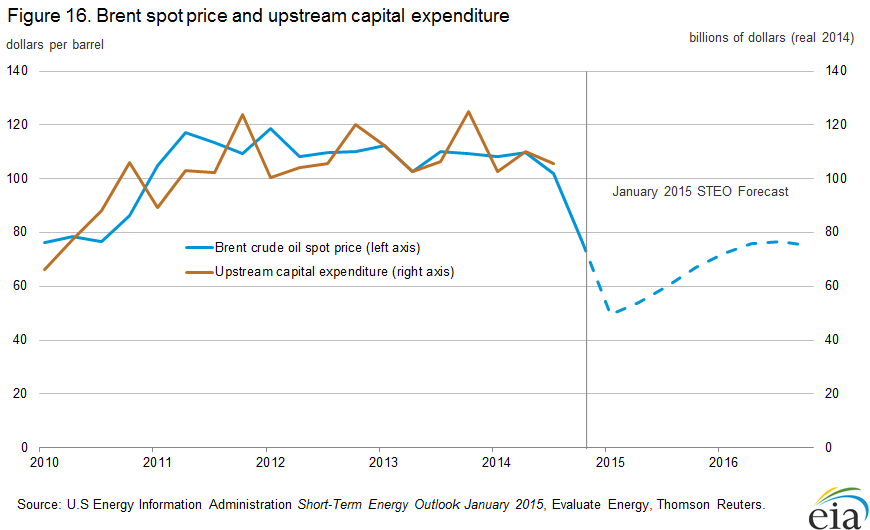
Because global spending on upstream investment is correlated with the price of crude oil (Figure 16), the recent crude oil price decline may influence oil producers to reduce upstream capital expenditures in 2015. Upstream projects require years to find and develop potential fields to bring to production. A significant decrease in price levels may discourage exploration activity and/or development of marginal fields, some of the more uncertain segments in the oil industry for generating returns. Although the decrease in capital expenditure may not impact current production significantly, it could result in lower production in the medium to long term.
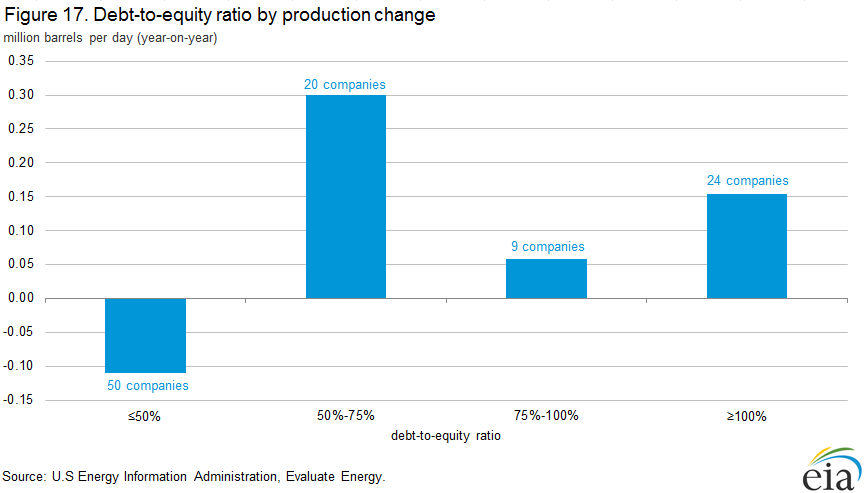
Reduced cash flow could particularly affect oil companies with high debt levels. Many of the companies that increased oil production in the past year had high debt-to-equity ratios (Figure 17). Because capital expenditure on potential fields must typically be financed long before production is realized, outside sources of funding are usually necessary in the initial phases of production. Much of the non-OPEC production growth in recent years was financed through debt. Typically, subsequent increases in production bring increased cash flow to service debt payments, but a price decline of the magnitude experienced in 2014 may leave some leveraged producers unable to make service payments or unable to roll over existing obligations at similar interest rates. Some companies could declare bankruptcy or be acquired by other companies with cash reserves.
In the January 2015 STEO, EIA projected that U.S. crude oil production will rise to 9.4 million barrels per day in the second quarter of 2015 (Figure 18) because some plays in Texas and North Dakota will remain profitable at low WTI price levels. However, beginning in the third quarter, EIA projected a decline of 190,000 barrels per day as cuts in investment by oil companies begin to impact drilling activity. Should there be any supply disruptions in other oil-producing nations during that same period, the reduced global oil supply could push oil prices higher.