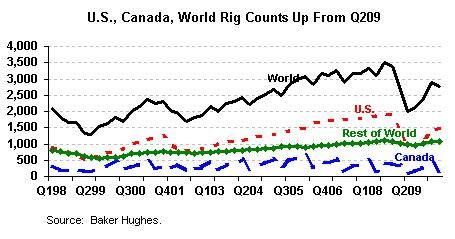
- U.S. oil rig counts increased by 174 percent in Q210 over the year-ago quarter to an average of 536 rigs, while U.S. gas rig counts increased 31 percent to an average of 957 rigs.
| Second Quarter 2010 Key Findings | |||
|---|---|---|---|
| Net Income: | $3.4 billion | Revenues: | $28.4 billion |
|
|||
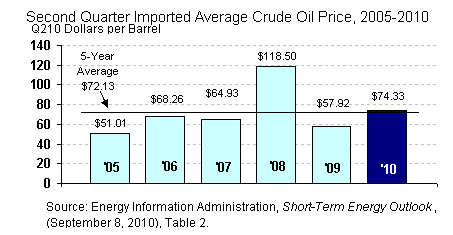
Net Income for Independent Energy Companies: (back to top)
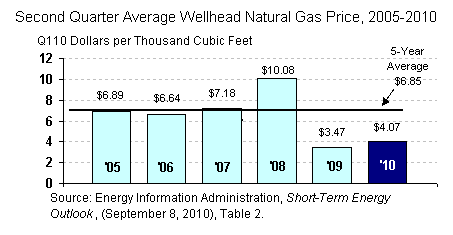
Revenues for Independent Energy Companies: (back to top)
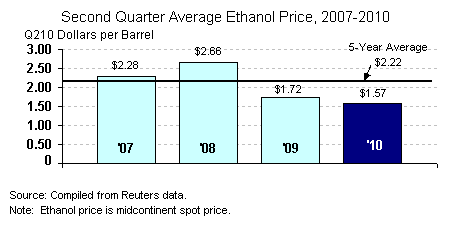
Ethanol Producer Second Quarter 2010 Revenue and Net Income: (back to top)
Supplemental Figures: (back to top)
Supplemental Tables: (back to top)
| Table 1. Revenue and Net Income Summaries for Independent Energy Companies | ||||||
|---|---|---|---|---|---|---|
| Companies | Q209 | Q210 | Percent Change |
First Half 2009 |
First Half 2010 |
Percent Change |
| Revenue | (Million Q210 Dollars)a | (Million Q210 Dollars)a | ||||
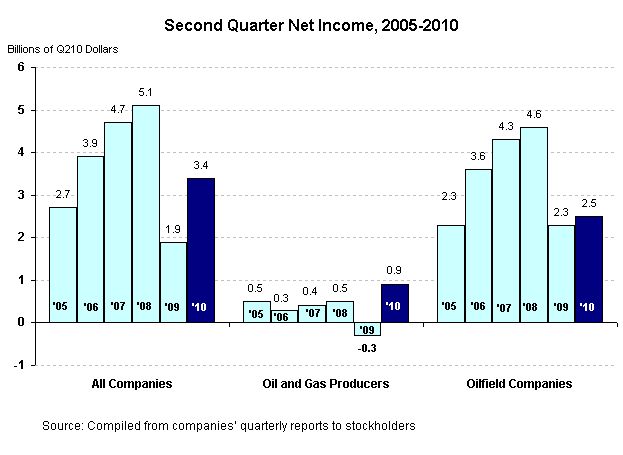
| Oil and Gas Producers (15)b | 2,644 | 4,130 | 55.1 | 5,488 | 8,553 | 55.9 |
| Oilfield Companies (17) | 21,583 | 23,021 | 6.7 | 45,233 | 44,237 | -2.2 |
| Ethanol Producers (13) | 1,182 | 1,240 | 4.9 | 2,372 | 2,591 | 9.2 |
| Total Revenue (45) | 25,428 | 28,392 | 11.7 | 53,094 | 55,381 | 4.3 |
| Net Income | ||||||
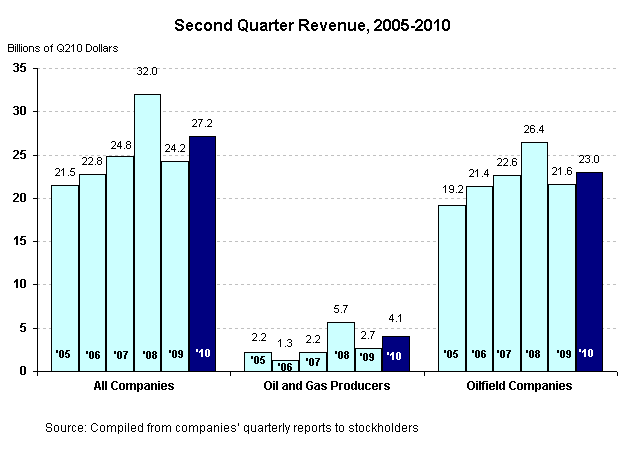
| Oil and Gas Producers (15) | -313 | 869 | 377.4 | -2,996 | 2,103 | 170.2 |
| Oilfield Companies (17) | 2,251 | 2,516 | 11.8 | 5,763 | 5,008 | -13.1 |
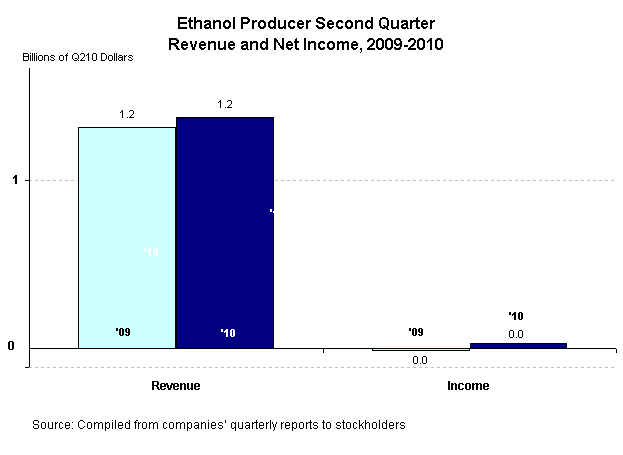
| Ethanol Producers (13) | -12 | 29 | 354.2 | -77 | 93 | 221.0 |
| Total Income (45) | 1,927 | 3,415 | 77.2 | 2,690 | 7,204 | 167.8 |
| a Values have been converted to constant Q210 dollars using the GDP price deflator series. | ||||||
| b The number of companies reporting revenue and net income is in parentheses. | ||||||
| Notes: Percentages are calculated from unrounded data. | ||||||
| Sources: Compiled from companies' quarterly reports to stockholders. | ||||||
| Table 2. U.S. Energy Prices | ||||||
|---|---|---|---|---|---|---|
| Q209 | Q210 | Percent Change |
||||
| U.S. Energy Prices | (Q210 Dollars) |
|||||
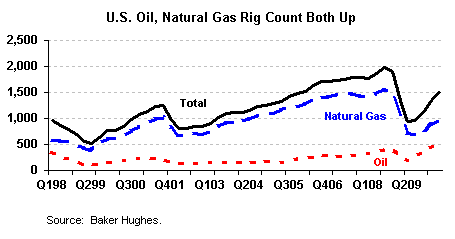
| Imported Crude Oil Price ($/barrel)a | 57.99 | 74.33 | 28.2 | |||
| Natural Gas Wellhead Price ($/thousand cubic feet)a | 3.47 | 4.07 | 17.3 | |||
| Ethanol Midcontinent Spot Price ($/barrel)b | 1.72 | 1.57 | -9.0 | |||
| a Energy Information Administration, Short-Term Energy Outlook, (September 8, 2010), Table 2. | ||||||
| b Compiled from Reuters data. | ||||||
To be automatically notified via e-mail of updates to this report and to other Energy Finance products, go to the list-serve sign-up page, enter your e-mail address, select the box beside "Financial and Industry Analysis," and then press "subscribe." You will then be notified within an hour of any updates.