|
Download Data (XLS File) |
|
||||||||
|
||||||||
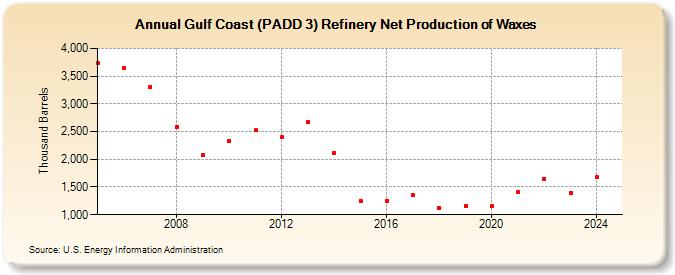
| Gulf Coast (PADD 3) Refinery Net Production of Waxes (Thousand Barrels) | ||||||||
| Decade | Year-0 | Year-1 | Year-2 | Year-3 | Year-4 | Year-5 | Year-6 | Year-7 | Year-8 | Year-9 |
|---|---|---|---|---|---|---|---|---|---|---|
| 2000's | 3,732 | 3,652 | 3,310 | 2,584 | 2,074 | |||||
| 2010's | 2,337 | 2,519 | 2,401 | 2,672 | 2,115 | 1,256 | 1,254 | 1,348 | 1,121 | 1,160 |
| 2020's | 1,156 | 1,413 | 1,643 | 1,400 |
| - = No Data Reported; -- = Not Applicable; NA = Not Available; W = Withheld to avoid disclosure of individual company data. |
| Release Date: 6/28/2024 |
| Next Release Date: 8/30/2024 |
Referring Pages: