|
Download Data (XLS File) |
|
||||||||
|
||||||||
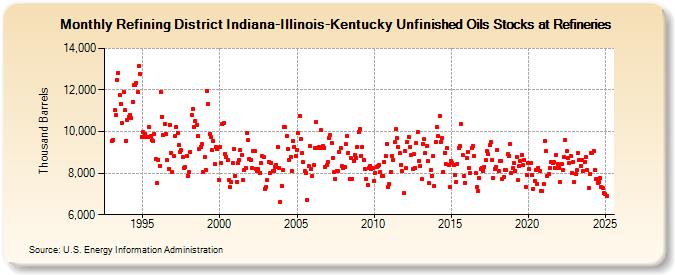
| Refining District Indiana-Illinois-Kentucky Unfinished Oils Stocks at Refineries (Thousand Barrels) | ||||||||
| Year | Jan | Feb | Mar | Apr | May | Jun | Jul | Aug | Sep | Oct | Nov | Dec |
|---|---|---|---|---|---|---|---|---|---|---|---|---|
| 1993 | 9,544 | 9,609 | 11,029 | 10,787 | 12,500 | 12,840 | 11,765 | 11,344 | 10,420 | 11,905 | 11,013 | 9,561 |
| 1994 | 10,578 | 10,722 | 10,807 | 10,664 | 11,411 | 12,235 | 12,230 | 12,356 | 11,892 | 13,176 | 12,759 | 9,732 |
| 1995 | 9,964 | 9,758 | 9,890 | 9,746 | 9,762 | 10,209 | 9,782 | 9,581 | 9,523 | 9,901 | 8,671 | 7,512 |
| 1996 | 8,653 | 8,356 | 11,894 | 10,721 | 9,812 | 10,378 | 9,878 | 8,608 | 8,222 | 10,330 | 8,988 | 8,038 |
| 1997 | 8,821 | 9,805 | 10,230 | 9,936 | 9,344 | 9,025 | 9,098 | 8,758 | 8,268 | 8,283 | 8,828 | 7,858 |
| 1998 | 8,037 | 9,027 | 10,807 | 11,085 | 10,243 | 10,520 | 10,306 | 9,782 | 9,178 | 9,271 | 9,383 | 8,033 |
| 1999 | 8,763 | 8,150 | 11,957 | 11,309 | 9,870 | 9,744 | 9,094 | 9,536 | 8,422 | 9,267 | 9,149 | 7,688 |
| 2000 | 9,271 | 8,464 | 10,344 | 10,410 | 8,934 | 8,772 | 8,615 | 7,667 | 7,309 | 7,552 | 8,482 | 9,169 |
| 2001 | 7,882 | 7,589 | 8,466 | 8,645 | 9,100 | 8,862 | 7,674 | 8,151 | 8,246 | 9,954 | 9,573 | 8,692 |
| 2002 | 8,650 | 8,238 | 9,053 | 9,070 | 8,222 | 8,106 | 8,198 | 7,989 | 8,493 | 8,804 | 8,765 | 7,229 |
| 2003 | 7,321 | 7,651 | 8,551 | 7,987 | 8,504 | 8,098 | 8,097 | 8,292 | 8,404 | 9,261 | 8,227 | 6,614 |
| 2004 | 7,395 | 8,135 | 10,224 | 10,207 | 9,799 | 9,147 | 8,626 | 8,794 | 8,125 | 9,569 | 9,269 | 8,818 |
| 2005 | 9,114 | 9,941 | 10,763 | 9,664 | 8,964 | 8,517 | 8,090 | 8,026 | 6,717 | 8,320 | 9,293 | 8,193 |
| 2006 | 7,856 | 8,371 | 9,203 | 10,442 | 9,208 | 9,255 | 9,186 | 10,052 | 9,294 | 9,210 | 8,309 | 8,379 |
| 2007 | 8,535 | 9,678 | 9,841 | 9,461 | 8,720 | 8,060 | 7,738 | 8,119 | 8,088 | 8,995 | 9,205 | 8,325 |
| 2008 | 8,258 | 8,311 | 9,381 | 9,764 | 8,989 | 7,712 | 8,725 | 7,736 | 8,607 | 8,865 | 8,722 | 9,265 |
| 2009 | 9,962 | 10,117 | 8,828 | 9,251 | 8,623 | 8,203 | 7,734 | 7,431 | 8,253 | 8,346 | 8,221 | 8,251 |
| 2010 | 7,615 | 8,017 | 8,300 | 8,347 | 8,396 | 8,043 | 7,845 | 7,856 | 8,546 | 8,820 | 9,387 | 7,340 |
| 2011 | 7,494 | 8,034 | 8,826 | 8,649 | 9,479 | 10,132 | 9,668 | 9,245 | 8,949 | 8,395 | 8,091 | 7,053 |
| 2012 | 9,052 | 8,244 | 9,496 | 9,741 | 9,250 | 8,862 | 8,183 | 8,903 | 8,266 | 9,433 | 9,982 | 8,562 |
| 2013 | 8,339 | 7,699 | 9,417 | 9,624 | 8,957 | 9,318 | 8,594 | 7,518 | 8,136 | 7,881 | 8,826 | 7,384 |
| 2014 | 9,495 | 10,216 | 9,785 | 10,757 | 9,515 | 9,683 | 8,058 | 8,990 | 8,418 | 9,199 | 8,408 | 7,321 |
| 2015 | 8,576 | 8,507 | 8,401 | 7,903 | 7,563 | 8,451 | 9,187 | 9,282 | 10,362 | 8,852 | 7,852 | 7,540 |
| 2016 | 8,748 | 9,028 | 8,266 | 7,995 | 9,205 | 9,289 | 8,829 | 8,012 | 7,345 | 7,120 | 7,754 | 8,188 |
| 2017 | 8,266 | 8,112 | 8,307 | 8,612 | 9,045 | 8,906 | 9,341 | 9,489 | 8,635 | 7,778 | 8,208 | 8,313 |
| 2018 | 9,135 | 8,107 | 8,596 | 8,584 | 7,740 | 7,829 | 8,165 | 8,132 | 8,902 | 8,832 | 9,395 | 8,009 |
| 2019 | 8,236 | 8,480 | 8,120 | 8,800 | 7,651 | 8,348 | 8,590 | 8,885 | 8,396 | 8,629 | 7,345 | 7,929 |
| 2020 | 8,504 | 8,188 | 8,464 | 7,934 | 7,242 | 7,641 | 8,162 | 7,491 | 8,265 | 8,098 | 7,153 | 7,126 |
| 2021 | 7,482 | 9,522 | 9,051 | 7,861 | 7,970 | 8,230 | 8,558 | 8,487 | 8,530 | 8,267 | 8,887 | 8,442 |
| 2022 | 8,260 | 7,554 | 8,438 | 8,160 | 8,776 | 9,598 | 9,060 | 8,716 | 8,506 | 8,813 | 8,022 | 8,538 |
| 2023 | 7,573 | 7,952 | 8,132 | 8,953 | 8,616 | 8,366 | 8,639 | 8,120 | 8,541 | 8,762 | 8,145 | 7,298 |
| 2024 | 7,971 | 8,969 | ||||||||||
| - = No Data Reported; -- = Not Applicable; NA = Not Available; W = Withheld to avoid disclosure of individual company data. |
| Release Date: 4/30/2024 |
| Next Release Date: 5/31/2024 |