|
Download Data (XLS File) |
|
||||||||
|
||||||||
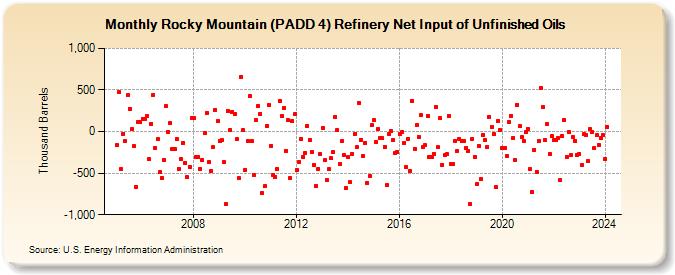
| Rocky Mountain (PADD 4) Refinery Net Input of Unfinished Oils (Thousand Barrels) | ||||||||
| Year | Jan | Feb | Mar | Apr | May | Jun | Jul | Aug | Sep | Oct | Nov | Dec |
|---|---|---|---|---|---|---|---|---|---|---|---|---|
| 2005 | -166 | 473 | -453 | -25 | -114 | 437 | 276 | 25 | -178 | -661 | 115 | 114 |
| 2006 | 156 | 145 | 191 | -334 | 94 | 440 | -196 | -93 | -487 | -555 | -337 | 302 |
| 2007 | -1 | 102 | -207 | -207 | -95 | -446 | -334 | -134 | -374 | -551 | -423 | 167 |
| 2008 | 163 | -311 | -305 | -451 | -341 | -18 | 227 | -371 | -473 | -190 | 264 | 129 |
| 2009 | -118 | -104 | -366 | -876 | 248 | 21 | 236 | 217 | -92 | -562 | 659 | 13 |
| 2010 | -461 | -115 | 425 | -112 | -523 | 135 | 311 | 216 | -741 | -658 | 66 | 322 |
| 2011 | -173 | -520 | -542 | -453 | 368 | 189 | 279 | -230 | 134 | -559 | 129 | 208 |
| 2012 | -463 | -366 | -85 | -304 | -255 | 71 | -98 | -240 | -405 | -653 | -445 | -270 |
| 2013 | 47 | -347 | -588 | -455 | -322 | -250 | 176 | 17 | -392 | -114 | -285 | -678 |
| 2014 | -310 | -611 | -269 | -32 | -191 | 347 | -96 | -292 | -136 | -617 | -532 | 74 |
| 2015 | 137 | -121 | 28 | -72 | -80 | -183 | -646 | -32 | 7 | -104 | -260 | -245 |
| 2016 | -28 | -10 | -135 | -429 | -86 | -475 | 372 | -207 | 74 | -67 | 198 | -184 |
| 2017 | -167 | 189 | -311 | -302 | -265 | 300 | -189 | 158 | -399 | -286 | -275 | 188 |
| 2018 | -385 | -396 | -119 | -233 | -91 | -117 | -117 | -192 | -228 | -872 | -89 | -302 |
| 2019 | -635 | -172 | -573 | -37 | -103 | -183 | 175 | 59 | -28 | -670 | 126 | 22 |
| 2020 | -202 | -198 | -292 | 112 | 188 | -75 | -344 | 325 | 61 | -70 | -114 | -4 |
| 2021 | 35 | -452 | -726 | -218 | -483 | -112 | 528 | 293 | -102 | 86 | -264 | -59 |
| 2022 | -103 | -102 | -77 | -585 | -49 | 139 | -300 | -5 | -285 | -67 | -111 | -278 |
| 2023 | -267 | -402 | -33 | -37 | -356 | 27 | -3 | -197 | -46 | -160 | -74 | -43 |
| 2024 | -327 | |||||||||||
| - = No Data Reported; -- = Not Applicable; NA = Not Available; W = Withheld to avoid disclosure of individual company data. |
| Release Date: 3/29/2024 |
| Next Release Date: 4/30/2024 |
Referring Pages: