|
Download Data (XLS File) |
|
||||||||
|
||||||||
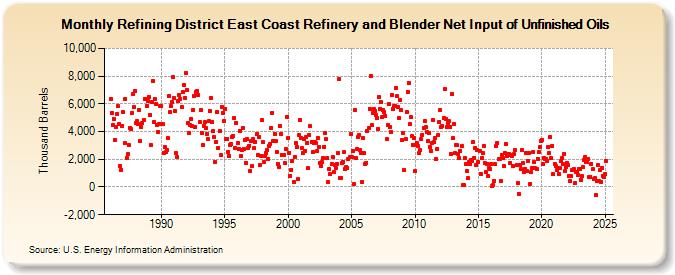
| Refining District East Coast Refinery and Blender Net Input of Unfinished Oils (Thousand Barrels) | ||||||||
| Year | Jan | Feb | Mar | Apr | May | Jun | Jul | Aug | Sep | Oct | Nov | Dec |
|---|---|---|---|---|---|---|---|---|---|---|---|---|
| 1986 | 6,357 | 5,341 | 4,465 | 4,932 | 3,401 | 4,325 | 5,253 | 5,815 | 4,569 | 1,518 | 1,245 | 4,389 |
| 1987 | 5,389 | 3,167 | 6,358 | 2,090 | 2,357 | 3,065 | 4,259 | 4,161 | 5,357 | 6,687 | 5,747 | 6,913 |
| 1988 | 4,616 | 4,759 | 4,525 | 5,541 | 3,307 | 4,338 | 4,600 | 4,839 | 6,358 | 6,376 | 5,871 | 6,187 |
| 1989 | 6,504 | 5,217 | 3,034 | 6,101 | 7,651 | 4,694 | 6,346 | 6,021 | 4,474 | 3,994 | 4,567 | 5,879 |
| 1990 | 5,808 | 4,536 | 2,482 | 2,871 | 2,503 | 2,652 | 3,523 | 6,569 | 5,409 | 5,854 | 6,108 | 7,914 |
| 1991 | 6,395 | 5,494 | 2,460 | 2,180 | 6,233 | 6,634 | 6,364 | 5,739 | 6,851 | 7,377 | 6,430 | 8,235 |
| 1992 | 6,992 | 4,606 | 3,880 | 4,444 | 4,927 | 4,365 | 5,555 | 6,578 | 4,319 | 6,886 | 6,920 | 6,663 |
| 1993 | 4,683 | 5,536 | 3,925 | 3,062 | 4,435 | 4,668 | 4,280 | 3,828 | 3,465 | 4,737 | 5,495 | 6,431 |
| 1994 | 4,694 | 4,022 | 3,623 | 1,806 | 3,258 | 5,429 | 2,818 | 4,026 | 2,298 | 5,797 | 5,327 | 4,764 |
| 1995 | 5,642 | 3,441 | 3,457 | 2,531 | 2,271 | 3,036 | 3,105 | 3,642 | 3,693 | 4,990 | 2,797 | 4,642 |
| 1996 | 3,162 | 2,720 | 4,062 | 2,245 | 2,637 | 4,256 | 2,741 | 3,395 | 1,764 | 3,492 | 2,836 | 2,977 |
| 1997 | 1,160 | 3,333 | 1,488 | 3,440 | 2,788 | 3,271 | 3,841 | 2,316 | 3,613 | 1,569 | 2,256 | 4,815 |
| 1998 | 3,241 | 1,829 | 2,258 | 2,465 | 2,639 | 2,046 | 2,968 | 3,085 | 4,288 | 5,347 | 3,343 | 3,844 |
| 1999 | 3,318 | 2,551 | 1,684 | 1,445 | 4,430 | 3,843 | 2,344 | 2,328 | 2,322 | 1,707 | 2,710 | 5,079 |
| 2000 | 3,560 | 2,476 | 828 | 1,257 | 1,902 | 371 | 2,199 | 3,173 | 2,896 | 551 | 3,730 | 4,845 |
| 2001 | 3,509 | 2,779 | 2,469 | 3,454 | 2,614 | 3,643 | 3,180 | 1,346 | 3,747 | 4,382 | 3,262 | 2,540 |
| 2002 | 3,187 | 3,277 | 3,179 | 2,572 | 3,547 | 2,915 | 1,724 | 1,499 | 1,799 | 2,073 | 2,912 | 3,906 |
| 2003 | 3,442 | 2,108 | 340 | 1,294 | 948 | 1,669 | 2,161 | 1,078 | 1,609 | 1,344 | 1,665 | 2,449 |
| 2004 | 7,760 | 661 | 634 | 1,735 | 1,809 | 2,537 | 1,325 | 1,447 | 1,391 | 1,993 | 2,137 | 3,792 |
| 2005 | 2,156 | 2,566 | 207 | 5,522 | 2,092 | 2,744 | 3,623 | 3,752 | 2,701 | 2,482 | 363 | 3,537 |
| 2006 | 2,426 | 1,623 | 1,752 | 4,052 | 4,243 | 5,648 | 8,044 | 4,469 | 5,369 | 5,598 | 5,502 | 5,195 |
| 2007 | 4,977 | 4,172 | 6,493 | 5,649 | 6,101 | 5,023 | 5,530 | 5,412 | 5,142 | 3,464 | 4,460 | 5,966 |
| 2008 | 4,294 | 3,990 | 6,620 | 5,657 | 5,811 | 5,833 | 7,166 | 6,553 | 5,777 | 4,968 | 6,246 | 5,531 |
| 2009 | 3,374 | 3,901 | 1,222 | 3,465 | 5,397 | 6,881 | 7,513 | 4,509 | 5,016 | 3,644 | 3,049 | 3,517 |
| 2010 | 1,128 | 3,050 | 3,159 | 2,922 | 2,458 | 2,639 | 3,440 | 3,778 | 4,248 | 4,751 | 4,297 | 3,950 |
| 2011 | 3,304 | 3,867 | 2,906 | 2,632 | 3,156 | 4,805 | 3,240 | 3,526 | 1,987 | 2,772 | 3,740 | 4,722 |
| 2012 | 5,533 | 4,321 | 4,433 | 4,960 | 7,062 | 4,938 | 4,305 | 4,629 | 4,743 | 4,356 | 2,392 | 6,741 |
| 2013 | 3,505 | 4,562 | 2,447 | 3,016 | 3,000 | 2,351 | 2,064 | 2,582 | 2,973 | 109 | 138 | 2,076 |
| 2014 | 1,649 | 1,154 | 628 | 1,819 | 1,675 | 1,930 | 1,874 | 3,230 | 2,103 | 2,834 | 1,554 | 2,660 |
| 2015 | 1,801 | 2,605 | 968 | 2,094 | 2,480 | 2,963 | 1,738 | 1,084 | 1,681 | 811 | 1,337 | 1,301 |
| 2016 | 1,678 | 67 | 153 | 460 | 1,627 | 2,976 | 3,184 | 1,993 | 2,053 | 398 | 2,307 | 2,112 |
| 2017 | 1,516 | 2,449 | 3,112 | 2,257 | 2,413 | 2,349 | 1,744 | 2,329 | 2,249 | 1,528 | 2,347 | 2,636 |
| 2018 | 1,582 | 295 | -501 | 1,579 | 1,277 | 2,654 | 1,733 | 1,079 | 1,324 | 2,436 | 1,143 | 1,850 |
| 2019 | 2,422 | 251 | 1,077 | 1,339 | 2,516 | 1,798 | 1,351 | 1,320 | 2,041 | 2,495 | 2,855 | 3,298 |
| 2020 | 3,375 | 1,645 | 2,098 | 2,030 | 2,023 | 1,875 | 2,868 | 2,460 | 3,609 | 2,088 | 2,978 | 918 |
| 2021 | 1,670 | 1,508 | 1,206 | 1,377 | 952 | 1,402 | 1,848 | 2,076 | 1,642 | 2,380 | 1,175 | 1,461 |
| 2022 | 1,753 | 1,557 | 776 | 431 | 761 | 1,254 | 1,313 | 283 | 1,103 | 1,065 | 889 | 1,327 |
| 2023 | 1,308 | 537 | 763 | 1,407 | 1,945 | 2,163 | 1,791 | 1,835 | 2,018 | 685 | 751 | 1,674 |
| 2024 | 1,276 | 571 | 623 | -562 | ||||||||
| - = No Data Reported; -- = Not Applicable; NA = Not Available; W = Withheld to avoid disclosure of individual company data. |
| Release Date: 6/28/2024 |
| Next Release Date: 7/31/2024 |