|
Download Data (XLS File) |
|
||||||||
|
||||||||
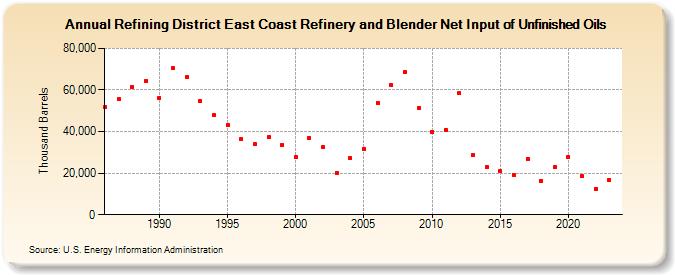
| Refining District East Coast Refinery and Blender Net Input of Unfinished Oils (Thousand Barrels) | ||||||||
| Decade | Year-0 | Year-1 | Year-2 | Year-3 | Year-4 | Year-5 | Year-6 | Year-7 | Year-8 | Year-9 |
|---|---|---|---|---|---|---|---|---|---|---|
| 1980's | 51,610 | 55,550 | 61,317 | 64,482 | ||||||
| 1990's | 56,229 | 70,392 | 66,135 | 54,545 | 47,862 | 43,247 | 36,287 | 33,890 | 37,353 | 33,761 |
| 2000's | 27,788 | 36,925 | 32,590 | 20,107 | 27,221 | 31,745 | 53,921 | 62,389 | 68,446 | 51,488 |
| 2010's | 39,820 | 40,657 | 58,413 | 28,823 | 23,110 | 20,863 | 19,008 | 26,929 | 16,451 | 22,763 |
| 2020's | 27,967 | 18,697 | 12,512 | 16,877 |
| - = No Data Reported; -- = Not Applicable; NA = Not Available; W = Withheld to avoid disclosure of individual company data. |
| Release Date: 6/28/2024 |
| Next Release Date: 8/30/2024 |