|
Download Data (XLS File) |
|
||||||||
|
||||||||
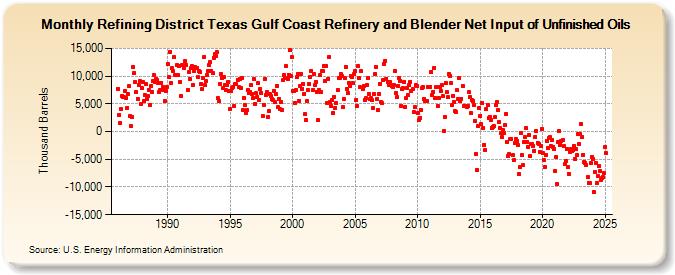
| Refining District Texas Gulf Coast Refinery and Blender Net Input of Unfinished Oils (Thousand Barrels) | ||||||||
| Year | Jan | Feb | Mar | Apr | May | Jun | Jul | Aug | Sep | Oct | Nov | Dec |
|---|---|---|---|---|---|---|---|---|---|---|---|---|
| 1986 | 7,728 | 3,067 | 1,455 | 3,986 | 6,388 | 6,287 | 6,200 | 7,331 | 6,070 | 4,276 | 6,754 | 8,184 |
| 1987 | 2,721 | 924 | 2,601 | 11,685 | 10,556 | 8,967 | 7,205 | 5,925 | 8,371 | 9,038 | 4,908 | 7,794 |
| 1988 | 8,869 | 5,590 | 6,549 | 8,569 | 5,921 | 6,402 | 7,581 | 4,859 | 8,221 | 7,092 | 9,101 | 10,185 |
| 1989 | 8,909 | 9,550 | 9,285 | 8,758 | 7,206 | 7,546 | 8,793 | 8,103 | 7,411 | 5,470 | 7,301 | 8,118 |
| 1990 | 12,110 | 9,829 | 14,419 | 8,799 | 11,377 | 10,890 | 13,361 | 10,207 | 10,241 | 11,922 | 10,232 | 11,811 |
| 1991 | 8,964 | 6,454 | 11,952 | 11,956 | 11,550 | 12,652 | 12,051 | 7,495 | 10,685 | 9,495 | 11,391 | 11,815 |
| 1992 | 8,428 | 10,996 | 11,633 | 11,488 | 11,448 | 9,867 | 10,911 | 10,780 | 8,559 | 7,710 | 9,592 | 13,474 |
| 1993 | 8,379 | 9,045 | 10,121 | 10,914 | 11,949 | 12,456 | 10,990 | 10,485 | 13,285 | 13,941 | 13,604 | 14,330 |
| 1994 | 5,965 | 5,434 | 8,568 | 10,336 | 9,611 | 7,914 | 9,818 | 8,460 | 7,491 | 8,330 | 8,983 | 7,351 |
| 1995 | 4,121 | 7,253 | 7,793 | 8,093 | 4,606 | 8,513 | 8,504 | 9,382 | 7,972 | 9,525 | 7,807 | 9,707 |
| 1996 | 3,799 | 6,122 | 4,783 | 3,365 | 3,935 | 7,464 | 6,995 | 7,176 | 8,370 | 6,849 | 6,052 | 9,402 |
| 1997 | 5,018 | 6,899 | 6,254 | 8,767 | 5,763 | 7,687 | 6,941 | 2,751 | 4,848 | 9,482 | 6,534 | 7,047 |
| 1998 | 2,631 | 3,687 | 6,729 | 6,467 | 5,940 | 5,689 | 7,403 | 5,276 | 6,685 | 8,274 | 4,395 | 5,799 |
| 1999 | 4,067 | 5,341 | 3,929 | 9,381 | 10,236 | 9,742 | 11,756 | 9,538 | 10,290 | 14,636 | 10,019 | 13,443 |
| 2000 | 7,319 | 7,225 | 5,118 | 7,530 | 9,829 | 10,402 | 5,571 | 8,261 | 10,416 | 7,730 | 8,646 | 6,860 |
| 2001 | 3,107 | 2,137 | 5,502 | 7,433 | 8,582 | 9,918 | 10,946 | 7,427 | 10,297 | 8,364 | 9,027 | 7,144 |
| 2002 | 2,121 | 7,453 | 10,133 | 7,052 | 10,944 | 10,993 | 11,782 | 9,118 | 11,852 | 5,142 | 9,481 | 13,482 |
| 2003 | 5,258 | 4,622 | 5,733 | 3,381 | 6,298 | 4,302 | 5,143 | 7,538 | 9,624 | 9,672 | 10,413 | 10,083 |
| 2004 | 4,416 | 5,886 | 9,627 | 11,720 | 7,761 | 6,944 | 8,797 | 8,170 | 10,053 | 9,870 | 8,701 | 10,336 |
| 2005 | 10,865 | 5,702 | 4,584 | 11,736 | 9,612 | 7,957 | 10,894 | 7,621 | 8,146 | 5,699 | 5,982 | 8,384 |
| 2006 | 9,624 | 6,777 | 5,820 | 5,983 | 5,643 | 4,240 | 6,863 | 10,387 | 11,708 | 5,931 | 3,867 | 6,800 |
| 2007 | 8,601 | 5,323 | 5,081 | 9,270 | 12,178 | 12,814 | 9,536 | 8,894 | 8,448 | 8,970 | 8,389 | 8,282 |
| 2008 | 8,109 | 8,415 | 10,998 | 6,944 | 6,216 | 8,275 | 9,584 | 9,173 | 4,658 | 7,639 | 7,809 | 9,009 |
| 2009 | 4,488 | 6,085 | 7,908 | 6,504 | 8,435 | 8,994 | 7,255 | 7,619 | 3,563 | 4,362 | 8,347 | 8,150 |
| 2010 | 3,387 | 2,114 | 2,514 | 3,964 | 7,788 | 7,973 | 5,943 | 5,594 | 5,530 | 5,506 | 8,073 | 7,994 |
| 2011 | 8,038 | 10,813 | 6,580 | 7,205 | 11,550 | 6,060 | 8,044 | 4,655 | 6,028 | 8,105 | 7,372 | 8,348 |
| 2012 | 6,431 | 181 | 2,638 | 8,734 | 7,085 | 6,169 | 10,389 | 10,084 | 8,825 | 4,746 | 6,473 | 5,248 |
| 2013 | 3,648 | 3,613 | 7,438 | 5,819 | 9,597 | 5,584 | 5,932 | 8,279 | 4,648 | 4,577 | 4,584 | 4,433 |
| 2014 | 4,575 | 7,092 | 6,191 | 3,364 | 5,613 | 5,600 | 4,784 | 1,980 | -4,133 | -6,948 | 951 | 4,248 |
| 2015 | 2,853 | 1,277 | 5,160 | 559 | -2,366 | -3,368 | 4,116 | 4,802 | 2,483 | 2,659 | 2,126 | 689 |
| 2016 | 895 | 1,046 | 2,666 | 4,806 | 5,375 | 3,830 | 1,760 | 662 | -266 | -1,009 | 220 | -308 |
| 2017 | 1,102 | 3,245 | -1,839 | -4,394 | -4,116 | -1,317 | -1,300 | -4,289 | -5,205 | -2,083 | -1,338 | -1,646 |
| 2018 | -2,479 | -7,615 | -6,386 | -219 | -4,191 | -6,099 | -1,854 | -1,000 | 675 | -1,802 | -2,705 | -617 |
| 2019 | -4,400 | -2,254 | -2,287 | -2,586 | -3,463 | -954 | 137 | -2,001 | -2,326 | -3,608 | -2,625 | 480 |
| 2020 | -3,883 | -5,177 | -6,468 | -4,189 | -1,649 | -3,000 | -1,195 | -1,043 | -2,567 | -1,529 | -2,715 | -3,155 |
| 2021 | -7,082 | -4,632 | -9,526 | -1,938 | 65 | -2,336 | -1,682 | -1,593 | -2,646 | -5,920 | -5,351 | -3,155 |
| 2022 | -6,409 | -7,575 | -3,671 | -3,157 | -3,574 | -3,361 | -2,586 | -4,868 | -3,213 | -4,315 | -528 | -2,256 |
| 2023 | -462 | 1,323 | -711 | -3,860 | -5,007 | -5,237 | -5,586 | -7,734 | -8,826 | -8,995 | -5,231 | -4,579 |
| 2024 | -5,001 | |||||||||||
| - = No Data Reported; -- = Not Applicable; NA = Not Available; W = Withheld to avoid disclosure of individual company data. |
| Release Date: 3/29/2024 |
| Next Release Date: 4/30/2024 |