|
Download Data (XLS File) |
|
||||||||
|
||||||||
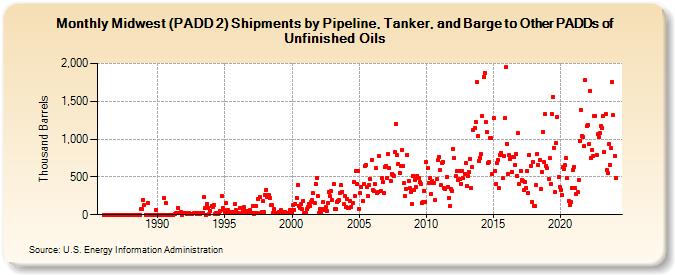
| Midwest (PADD 2) Shipments by Pipeline, Tanker, and Barge to Other PADDs of Unfinished Oils (Thousand Barrels) | ||||||||
| Year | Jan | Feb | Mar | Apr | May | Jun | Jul | Aug | Sep | Oct | Nov | Dec |
|---|---|---|---|---|---|---|---|---|---|---|---|---|
| 1986 | 0 | 0 | 0 | 0 | 0 | 0 | 0 | 0 | 0 | 0 | 0 | 0 |
| 1987 | 0 | 0 | 0 | 0 | 0 | 0 | 0 | 0 | 0 | 0 | 0 | 0 |
| 1988 | 0 | 0 | 0 | 0 | 0 | 0 | 0 | 0 | 0 | 74 | 74 | 200 |
| 1989 | 124 | 0 | 0 | 161 | 0 | 0 | 0 | 0 | 0 | 0 | 62 | 0 |
| 1990 | 0 | 0 | 0 | 0 | 0 | 0 | 219 | 152 | 0 | 0 | 0 | 0 |
| 1991 | 0 | 0 | 0 | 9 | 17 | 28 | 93 | 28 | 19 | 36 | 0 | 28 |
| 1992 | 18 | 22 | 8 | 9 | 18 | 9 | 9 | 15 | 17 | 18 | 19 | 9 |
| 1993 | 9 | 28 | 10 | 27 | 29 | 234 | 85 | 0 | 147 | 88 | 9 | 50 |
| 1994 | 119 | 106 | 132 | 8 | 17 | 9 | 7 | 18 | 55 | 242 | 88 | 64 |
| 1995 | 36 | 154 | 38 | 57 | 39 | 18 | 38 | 33 | 29 | 147 | 56 | 27 |
| 1996 | 18 | 83 | 88 | 18 | 75 | 97 | 27 | 53 | 46 | 28 | 58 | 27 |
| 1997 | 28 | 121 | 12 | 27 | 112 | 18 | 205 | 233 | 17 | 36 | 175 | 33 |
| 1998 | 263 | 333 | 232 | 265 | 218 | 125 | 123 | 28 | 73 | 28 | 28 | 26 |
| 1999 | 34 | 27 | 56 | 28 | 36 | 36 | 36 | 27 | 24 | 25 | 60 | 68 |
| 2000 | 22 | 124 | 67 | 143 | 226 | 394 | 119 | 92 | 144 | 69 | 187 | 17 |
| 2001 | 27 | 75 | 96 | 145 | 118 | 171 | 191 | 281 | 155 | 405 | 488 | 249 |
| 2002 | 17 | 80 | 23 | 73 | 167 | 57 | 97 | 46 | 155 | 306 | 244 | 308 |
| 2003 | 192 | 408 | 74 | 73 | 172 | 185 | 190 | 289 | 387 | 306 | 146 | 248 |
| 2004 | 103 | 202 | 88 | 93 | 185 | 108 | 156 | 430 | 247 | 584 | 411 | 576 |
| 2005 | 82 | 282 | 366 | 185 | 400 | 642 | 654 | 371 | 246 | 399 | 466 | 729 |
| 2006 | 329 | 310 | 400 | 616 | 281 | 301 | 771 | 320 | 484 | 430 | 292 | 632 |
| 2007 | 650 | 486 | 797 | 617 | 449 | 537 | 526 | 514 | 829 | 1,201 | 789 | 676 |
| 2008 | 555 | 648 | 860 | 638 | 417 | 244 | 345 | 790 | 449 | 347 | 297 | 142 |
| 2009 | 516 | 332 | 463 | 371 | 515 | 481 | 431 | 409 | 154 | 167 | 318 | 174 |
| 2010 | 697 | 617 | 418 | 479 | 271 | 440 | 413 | 415 | 194 | 467 | 718 | 769 |
| 2011 | 593 | 389 | 678 | 700 | 349 | 343 | 500 | 370 | 227 | 114 | 342 | 317 |
| 2012 | 871 | 751 | 508 | 573 | 465 | 578 | 469 | 409 | 576 | 480 | 539 | 682 |
| 2013 | 386 | 510 | 570 | 739 | 350 | 625 | 1,116 | 1,150 | 1,230 | 1,753 | 1,036 | 716 |
| 2014 | 748 | 802 | 1,300 | 1,823 | 1,879 | 1,221 | 1,092 | 686 | 691 | 1,018 | 1,009 | 538 |
| 2015 | 1,275 | 575 | 407 | 683 | 730 | 349 | 794 | 821 | 480 | 781 | 1,277 | 1,949 |
| 2016 | 940 | 541 | 789 | 740 | 563 | 759 | 757 | 662 | 807 | 517 | 1,076 | 408 |
| 2017 | 581 | 460 | 452 | 323 | 434 | 350 | 578 | 290 | 792 | 648 | 170 | 699 |
| 2018 | 116 | 115 | 389 | 805 | 661 | 725 | 336 | 568 | 1,097 | 697 | 1,327 | 650 |
| 2019 | 615 | 471 | 746 | 404 | 1,336 | 1,561 | 888 | 294 | 943 | 1,295 | 505 | 365 |
| 2020 | 332 | 257 | 628 | 604 | 654 | 748 | 485 | 187 | 130 | 164 | 359 | 587 |
| 2021 | 634 | 353 | 277 | 296 | 464 | 976 | 1,381 | 1,044 | 1,028 | 907 | 1,776 | 1,167 |
| 2022 | 1,188 | 929 | 1,639 | 748 | 862 | 777 | 1,306 | 1,303 | 795 | 1,064 | 1,031 | 1,079 |
| 2023 | 1,167 | 1,148 | 1,311 | 828 | 1,330 | 588 | 546 | 937 | 662 | 880 | 1,761 | 1,315 |
| 2024 | 774 | |||||||||||
| - = No Data Reported; -- = Not Applicable; NA = Not Available; W = Withheld to avoid disclosure of individual company data. |
| Release Date: 3/29/2024 |
| Next Release Date: 4/30/2024 |