|
Download Data (XLS File) |
|
||||||||
|
||||||||
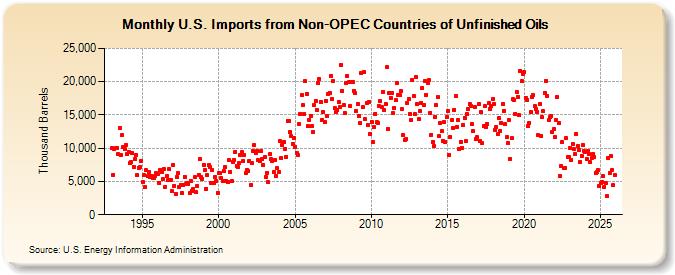
| U.S. Imports from Non-OPEC Countries of Unfinished Oils (Thousand Barrels) | ||||||||
| Year | Jan | Feb | Mar | Apr | May | Jun | Jul | Aug | Sep | Oct | Nov | Dec |
|---|---|---|---|---|---|---|---|---|---|---|---|---|
| 1993 | 9,988 | 6,021 | 9,896 | 9,999 | 10,061 | 9,111 | 13,013 | 8,970 | 11,933 | 10,249 | 9,910 | 10,510 |
| 1994 | 9,124 | 9,495 | 7,726 | 7,902 | 9,260 | 7,229 | 8,342 | 8,995 | 5,942 | 7,089 | 7,153 | 8,113 |
| 1995 | 4,927 | 5,909 | 4,162 | 6,664 | 5,807 | 6,432 | 5,715 | 5,880 | 5,580 | 5,532 | 5,891 | 6,240 |
| 1996 | 6,094 | 4,813 | 6,730 | 6,350 | 5,379 | 6,833 | 4,239 | 5,852 | 5,244 | 6,809 | 5,280 | 3,529 |
| 1997 | 7,476 | 4,385 | 3,118 | 5,725 | 6,264 | 4,185 | 4,410 | 3,287 | 4,522 | 5,735 | 4,575 | 4,768 |
| 1998 | 4,682 | 3,200 | 5,136 | 3,607 | 3,880 | 5,612 | 3,368 | 4,318 | 6,004 | 8,331 | 5,662 | 5,406 |
| 1999 | 7,510 | 6,715 | 3,904 | 5,934 | 7,529 | 7,113 | 4,803 | 6,699 | 4,821 | 5,730 | 5,104 | 3,303 |
| 2000 | 6,312 | 6,244 | 5,548 | 5,005 | 6,508 | 7,174 | 5,129 | 4,970 | 8,190 | 6,492 | 5,037 | 7,987 |
| 2001 | 8,232 | 9,469 | 7,332 | 7,195 | 7,726 | 8,922 | 9,424 | 8,048 | 8,969 | 6,314 | 6,781 | 6,643 |
| 2002 | 8,039 | 4,455 | 7,757 | 9,517 | 10,434 | 9,257 | 9,545 | 8,199 | 8,109 | 9,567 | 8,382 | 7,509 |
| 2003 | 8,689 | 5,709 | 6,320 | 4,860 | 9,064 | 8,371 | 8,000 | 6,420 | 8,210 | 5,852 | 7,008 | 6,400 |
| 2004 | 11,022 | 8,522 | 10,494 | 10,926 | 9,926 | 8,729 | 14,125 | 14,029 | 12,387 | 11,796 | 10,692 | 11,578 |
| 2005 | 10,249 | 9,318 | 9,024 | 13,693 | 15,155 | 17,994 | 16,442 | 15,109 | 20,047 | 18,157 | 13,280 | 14,246 |
| 2006 | 14,884 | 13,273 | 12,412 | 16,520 | 17,154 | 15,785 | 19,853 | 20,369 | 17,009 | 14,255 | 15,369 | 13,961 |
| 2007 | 17,137 | 14,896 | 18,127 | 18,324 | 20,883 | 17,467 | 20,026 | 16,010 | 15,365 | 15,689 | 16,982 | 16,168 |
| 2008 | 22,568 | 18,664 | 16,492 | 15,223 | 19,748 | 20,870 | 19,879 | 16,350 | 19,976 | 19,933 | 18,623 | 18,232 |
| 2009 | 15,519 | 16,713 | 14,885 | 13,777 | 21,259 | 16,169 | 21,403 | 14,329 | 16,755 | 13,501 | 16,907 | 12,195 |
| 2010 | 13,969 | 10,864 | 13,214 | 15,185 | 13,906 | 13,798 | 16,307 | 17,060 | 16,223 | 18,494 | 15,686 | 16,649 |
| 2011 | 22,195 | 12,924 | 18,306 | 17,591 | 18,268 | 15,310 | 16,033 | 17,210 | 19,818 | 17,923 | 17,950 | 18,594 |
| 2012 | 15,831 | 11,936 | 11,252 | 11,323 | 16,865 | 17,386 | 15,197 | 14,296 | 20,245 | 17,831 | 15,137 | 20,711 |
| 2013 | 16,630 | 14,381 | 15,527 | 16,742 | 19,051 | 16,467 | 20,122 | 18,050 | 19,737 | 20,233 | 15,329 | 12,043 |
| 2014 | 10,957 | 10,308 | 14,701 | 16,488 | 17,658 | 11,760 | 13,814 | 12,545 | 11,143 | 13,874 | 10,919 | 14,718 |
| 2015 | 15,632 | 9,019 | 11,685 | 14,213 | 13,054 | 15,753 | 17,782 | 13,259 | 14,167 | 9,824 | 10,986 | 10,073 |
| 2016 | 13,518 | 14,599 | 11,020 | 15,076 | 15,934 | 16,651 | 16,322 | 13,593 | 12,538 | 16,199 | 11,318 | 11,609 |
| 2017 | 16,582 | 11,072 | 15,386 | 10,707 | 13,321 | 16,277 | 13,135 | 13,663 | 16,751 | 15,900 | 16,288 | 17,346 |
| 2018 | 16,662 | 12,731 | 13,164 | 12,067 | 14,526 | 12,579 | 13,820 | 16,615 | 15,605 | 13,643 | 11,615 | 10,774 |
| 2019 | 14,181 | 8,350 | 11,458 | 17,333 | 17,288 | 15,195 | 18,513 | 17,762 | 14,935 | 21,630 | 20,094 | 21,191 |
| 2020 | 21,386 | 17,589 | 17,230 | 13,324 | 13,820 | 15,369 | 17,661 | 17,925 | 16,296 | 15,872 | 15,512 | 11,943 |
| 2021 | 16,640 | 11,900 | 14,637 | 15,547 | 18,367 | 20,171 | 17,864 | 14,175 | 14,674 | 14,865 | 12,382 | 12,864 |
| 2022 | 11,634 | 14,215 | 17,693 | 13,816 | 5,833 | 7,364 | 10,863 | 7,055 | 7,064 | 11,459 | 8,651 | 8,697 |
| 2023 | 10,057 | 8,251 | 10,682 | 10,072 | 9,099 | 12,166 | 10,362 | 9,673 | 7,920 | 8,899 | 10,537 | 9,623 |
| 2024 | 9,452 | |||||||||||
| - = No Data Reported; -- = Not Applicable; NA = Not Available; W = Withheld to avoid disclosure of individual company data. |
| Release Date: 3/29/2024 |
| Next Release Date: 4/30/2024 |