|
Download Data (XLS File) |
|
||||||||
|
||||||||
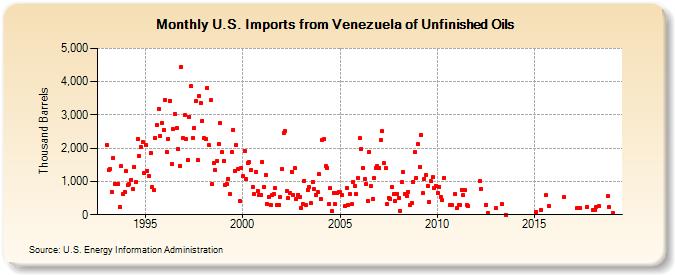
| U.S. Imports from Venezuela of Unfinished Oils (Thousand Barrels) | ||||||||
| Year | Jan | Feb | Mar | Apr | May | Jun | Jul | Aug | Sep | Oct | Nov | Dec |
|---|---|---|---|---|---|---|---|---|---|---|---|---|
| 1993 | 2,083 | 1,337 | 1,379 | 689 | 1,710 | 918 | 917 | 927 | 229 | 1,452 | 633 | 688 |
| 1994 | 1,301 | 889 | 914 | 1,051 | 777 | 1,442 | 990 | 2,274 | 1,766 | 2,029 | 2,172 | 1,258 |
| 1995 | 2,093 | 1,316 | 1,163 | 1,849 | 821 | 733 | 2,302 | 2,692 | 3,179 | 2,369 | 2,762 | 2,560 |
| 1996 | 3,442 | 1,887 | 2,280 | 3,430 | 1,523 | 2,574 | 3,019 | 2,610 | 1,974 | 1,472 | 4,444 | 2,292 |
| 1997 | 2,984 | 2,262 | 1,649 | 2,941 | 3,860 | 2,314 | 2,620 | 3,412 | 1,638 | 3,566 | 3,362 | 2,826 |
| 1998 | 2,295 | 2,280 | 3,817 | 2,087 | 3,439 | 909 | 1,560 | 1,339 | 1,610 | 2,111 | 2,761 | 1,875 |
| 1999 | 1,614 | 905 | 925 | 1,077 | 619 | 1,876 | 2,559 | 1,321 | 2,103 | 1,362 | 407 | 1,419 |
| 2000 | 1,149 | 1,915 | 1,069 | 1,543 | 1,582 | 1,347 | 844 | 609 | 1,287 | 714 | 599 | 607 |
| 2001 | 1,590 | 833 | 1,191 | 311 | 529 | 306 | 596 | 620 | 810 | 300 | 300 | 534 |
| 2002 | 1,376 | 2,468 | 2,502 | 722 | 512 | 645 | 1,293 | 599 | 1,391 | 466 | 605 | 525 |
| 2003 | 200 | 312 | 1,025 | 280 | 746 | 831 | 343 | 986 | 762 | 599 | 673 | 1,210 |
| 2004 | 463 | 2,254 | 2,266 | 1,452 | 1,419 | 328 | 797 | 103 | 654 | 309 | 641 | 672 |
| 2005 | 675 | 589 | 250 | 803 | 300 | 609 | 309 | 993 | 870 | 609 | 1,098 | |
| 2006 | 2,298 | 1,979 | 1,411 | 1,068 | 917 | 421 | 1,892 | 852 | 481 | 1,107 | 1,410 | 1,455 |
| 2007 | 1,404 | 2,257 | 2,514 | 1,547 | 1,411 | 309 | 509 | 487 | 820 | 608 | 407 | 628 |
| 2008 | 510 | 122 | 973 | 1,270 | 621 | 570 | 696 | 292 | 348 | 988 | 1,881 | 1,111 |
| 2009 | 2,116 | 1,446 | 2,397 | 640 | 1,085 | 1,198 | 873 | 386 | 999 | 1,123 | 789 | 856 |
| 2010 | 659 | 847 | 547 | 432 | 1,108 | 301 | 281 | 627 | ||||
| 2011 | 206 | 287 | 300 | 745 | 581 | 734 | 298 | 270 | ||||
| 2012 | 1,006 | 774 | 301 | 50 | ||||||||
| 2013 | 190 | 316 | 1 | |||||||||
| 2015 | 90 | 135 | 580 | 248 | ||||||||
| 2016 | 521 | |||||||||||
| 2017 | 189 | 188 | 234 | |||||||||
| 2018 | 150 | 149 | 240 | 250 | 550 | 226 | ||||||
| 2019 | 45 | |||||||||||
| - = No Data Reported; -- = Not Applicable; NA = Not Available; W = Withheld to avoid disclosure of individual company data. |
| Release Date: 6/28/2024 |
| Next Release Date: 7/31/2024 |