|
Download Data (XLS File) |
|
||||||||
|
||||||||
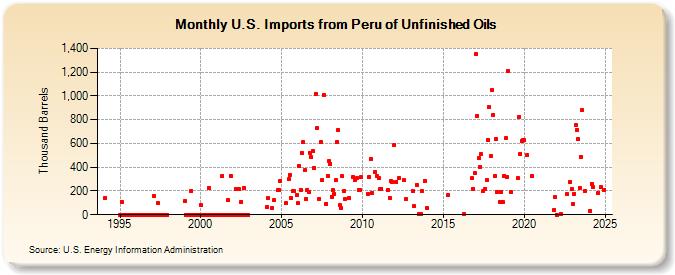
| U.S. Imports from Peru of Unfinished Oils (Thousand Barrels) | ||||||||
| Year | Jan | Feb | Mar | Apr | May | Jun | Jul | Aug | Sep | Oct | Nov | Dec |
|---|---|---|---|---|---|---|---|---|---|---|---|---|
| 1994 | 142 | |||||||||||
| 1995 | 0 | 111 | 0 | 0 | 0 | 0 | 0 | 0 | 0 | 0 | 0 | 0 |
| 1996 | 0 | 0 | 0 | 0 | 0 | 0 | 0 | 0 | 0 | 0 | 0 | 0 |
| 1997 | 0 | 160 | 0 | 0 | 100 | 0 | 0 | 0 | 0 | 0 | 0 | 0 |
| 1999 | 113 | 0 | 0 | 0 | 0 | 200 | 0 | 0 | 0 | 0 | 0 | 0 |
| 2000 | 80 | 0 | 0 | 0 | 0 | 0 | 229 | 0 | 0 | 0 | 0 | 0 |
| 2001 | 0 | 0 | 0 | 0 | 330 | 0 | 0 | 0 | 121 | 0 | 330 | 0 |
| 2002 | 0 | 0 | 218 | 0 | 219 | 0 | 110 | 0 | 229 | 0 | 0 | 0 |
| 2004 | 69 | 138 | 54 | 121 | 205 | 208 | 283 | |||||
| 2005 | 95 | 298 | 335 | 140 | 198 | 197 | 169 | |||||
| 2006 | 95 | 409 | 212 | 520 | 609 | 374 | 132 | 210 | 195 | 521 | 483 | 535 |
| 2007 | 396 | 1,019 | 726 | 133 | 609 | 291 | 1,006 | 94 | 328 | 452 | ||
| 2008 | 429 | 153 | 206 | 175 | 290 | 614 | 711 | 79 | 55 | 325 | 200 | 135 |
| 2009 | 140 | 320 | 290 | 307 | 209 | 209 | 319 | |||||
| 2010 | 176 | 319 | 470 | 186 | 357 | 322 | ||||||
| 2011 | 306 | 219 | 219 | 205 | 143 | 285 | 279 | 584 | ||||
| 2012 | 279 | 309 | 289 | 132 | ||||||||
| 2013 | 200 | 71 | 251 | 9 | 9 | 198 | 284 | |||||
| 2014 | 54 | |||||||||||
| 2015 | 165 | |||||||||||
| 2016 | 2 | 305 | 219 | 349 | ||||||||
| 2017 | 1,351 | 835 | 475 | 404 | 508 | 197 | 220 | 290 | 629 | 905 | 492 | |
| 2018 | 1,046 | 843 | 324 | 637 | 194 | 110 | 191 | 104 | 328 | 643 | 320 | |
| 2019 | 1,211 | 189 | 306 | 826 | 515 | 622 | 625 | |||||
| 2020 | 625 | 499 | 326 | |||||||||
| 2021 | 40 | 145 | ||||||||||
| 2022 | 0 | 7 | 171 | 277 | 218 | |||||||
| 2023 | 93 | 178 | 751 | 716 | 635 | 221 | 490 | 880 | 201 | |||
| - = No Data Reported; -- = Not Applicable; NA = Not Available; W = Withheld to avoid disclosure of individual company data. |
| Release Date: 3/29/2024 |
| Next Release Date: 4/30/2024 |