|
Download Data (XLS File) |
|
||||||||
|
||||||||
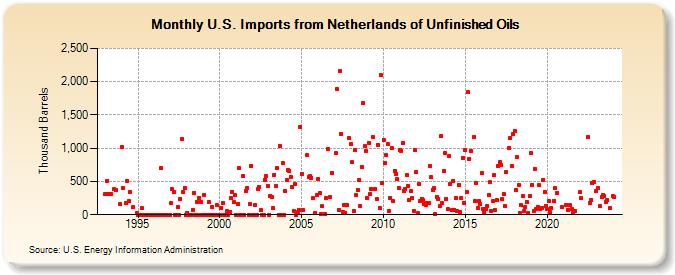
| U.S. Imports from Netherlands of Unfinished Oils (Thousand Barrels) | ||||||||
| Year | Jan | Feb | Mar | Apr | May | Jun | Jul | Aug | Sep | Oct | Nov | Dec |
|---|---|---|---|---|---|---|---|---|---|---|---|---|
| 1993 | 306 | 508 | 306 | 309 | 381 | 373 | 164 | |||||
| 1994 | 1,015 | 404 | 169 | 508 | 204 | 345 | 109 | 32 | ||||
| 1995 | 0 | 0 | 0 | 94 | 0 | 0 | 0 | 0 | 0 | 0 | 0 | 0 |
| 1996 | 0 | 0 | 0 | 0 | 0 | 701 | 0 | 0 | 0 | 0 | 0 | 0 |
| 1997 | 175 | 379 | 341 | 0 | 0 | 118 | 0 | 243 | 1,142 | 342 | 407 | 0 |
| 1998 | 32 | 0 | 0 | 0 | 76 | 333 | 0 | 192 | 0 | 256 | 190 | 0 |
| 1999 | 293 | 0 | 0 | 0 | 189 | 0 | 110 | 0 | 0 | 0 | 142 | 0 |
| 2000 | 0 | 104 | 169 | 0 | 0 | 53 | 0 | 38 | 247 | 345 | 191 | 292 |
| 2001 | 0 | 165 | 697 | 0 | 0 | 587 | 0 | 363 | 404 | 0 | 154 | 737 |
| 2002 | 0 | 0 | 141 | 0 | 383 | 414 | 64 | 0 | 0 | 527 | 580 | 438 |
| 2003 | 0 | 284 | 268 | 104 | 604 | 435 | 705 | 0 | 1,038 | 0 | 783 | 0 |
| 2004 | 353 | 529 | 678 | 662 | 571 | 413 | 50 | 466 | 0 | 35 | 73 | 1,315 |
| 2005 | 616 | 69 | 894 | 564 | 575 | 556 | 245 | 30 | 297 | |||
| 2006 | 539 | 325 | 13 | 124 | 18 | 246 | 983 | 260 | 626 | |||
| 2007 | 922 | 1,888 | 71 | 2,154 | 1,210 | 48 | 142 | 30 | 142 | 1,150 | ||
| 2008 | 1,067 | 785 | 59 | 973 | 292 | 373 | 528 | 134 | 723 | 1,686 | 1,030 | 956 |
| 2009 | 254 | 1,085 | 308 | 393 | 1,168 | 389 | 239 | 1,054 | 108 | 2,098 | 480 | |
| 2010 | 1,128 | 781 | 898 | 1,057 | 62 | 248 | 1,002 | 206 | 664 | 616 | 532 | 407 |
| 2011 | 969 | 956 | 1,078 | 355 | 387 | 600 | 436 | 214 | 349 | 245 | 61 | 973 |
| 2012 | 642 | 21 | 463 | 213 | 243 | 215 | 158 | 151 | 175 | 180 | 735 | 562 |
| 2013 | 376 | 399 | 5 | 267 | 242 | 126 | 1,178 | 173 | 659 | 927 | 241 | 82 |
| 2014 | 876 | 468 | 67 | 510 | 78 | 250 | 51 | 449 | 47 | 257 | 853 | 180 |
| 2015 | 980 | 341 | 1,840 | 840 | 959 | 1,165 | 202 | 475 | 107 | 205 | 158 | |
| 2016 | 623 | 86 | 40 | 90 | 130 | 294 | 485 | 62 | 201 | 595 | 65 | 225 |
| 2017 | 737 | 785 | 750 | 234 | 308 | 135 | 649 | 1,007 | 1,158 | 728 | 1,206 | |
| 2018 | 1,265 | 376 | 860 | 440 | 21 | 139 | 274 | 60 | 123 | 192 | 27 | 279 |
| 2019 | 927 | 454 | 52 | 689 | 82 | 121 | 446 | 87 | 106 | 529 | 345 | 135 |
| 2020 | 79 | 203 | 35 | 106 | 207 | 395 | 331 | 114 | ||||
| 2021 | 153 | 77 | 142 | 86 | 30 | 55 | ||||||
| 2022 | 336 | 250 | 1,167 | 180 | 220 | 471 | 499 | |||||
| 2023 | 362 | 402 | 129 | 263 | 298 | 274 | 186 | 218 | 98 | |||
| 2024 | 274 | |||||||||||
| - = No Data Reported; -- = Not Applicable; NA = Not Available; W = Withheld to avoid disclosure of individual company data. |
| Release Date: 3/29/2024 |
| Next Release Date: 4/30/2024 |